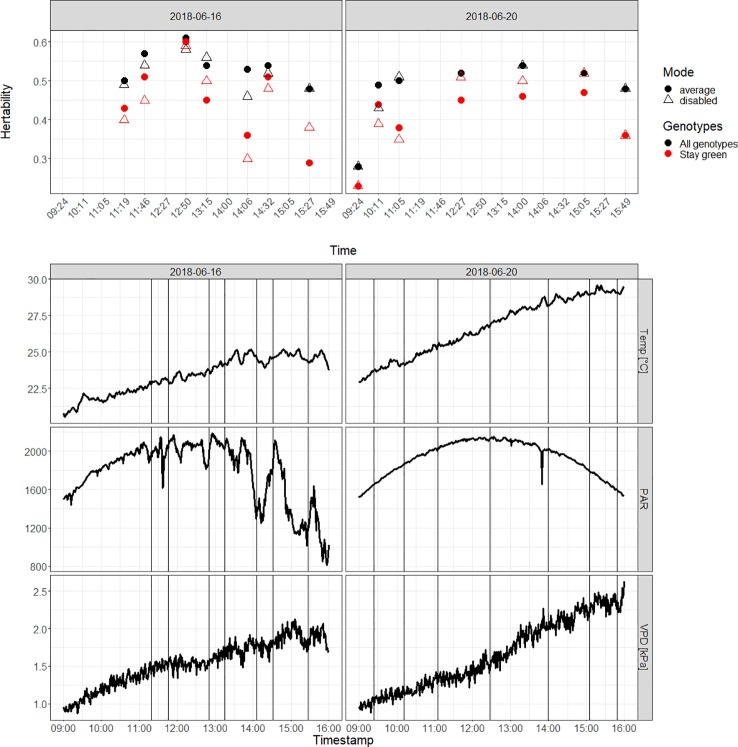
Figure 7.
Diurnal variation of H2 values on the 2018-06-16 and the 2018-06-20 (top) for all genotypes (black) and for “stay green” genotypes (red). Data were gathered using the blending mode set to “average.” Axis times in hours:minutes, local time. Diurnal variation of the temperature, the photosynthetically active radiation (PAR in μmol m−2s−1) and the vapor pressure deficit (VPD) on the 2018-06-16 and the 2018-06-20 (bottom). The vertical lines correspond to the start time of the unmanned aerial vehicles (UAV) flights.

