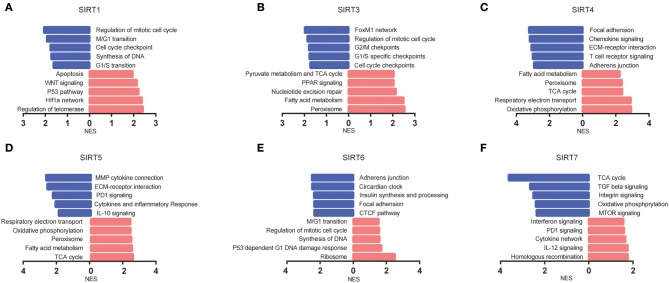
Figure 6.
The pathways associated with sirtuins alterations were predicted by GSEA. (A–F) Pathway alterations in the high-expression group vs. low-expression group. Pathways enriched in phenotype high were shown in red (right), and pathways enriched in phenotype low were shown in blue (left). All gene sets were significantly enriched at nominal p < 5% and FDR < 25%.

