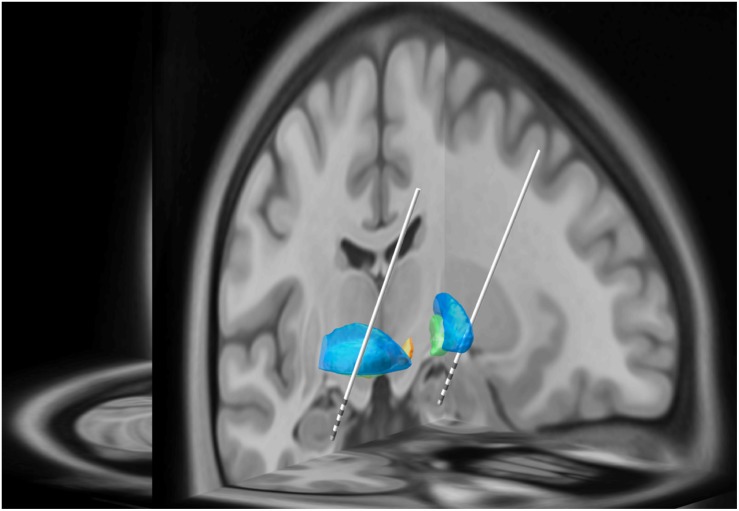
FIGURE 1.
In this three-dimensional image, Subject 2’s MRI brain imaging studies were registered to the MNI space (MNI152 NLIN2009a) and then overlaid on the structural atlas of Mai (Horn and Kühn, 2015; Mai and Majtanik, 2017). Here we demonstrate the trajectory for each DBS electrode implanted into the head of the HC and amygdala as represented in “MNI space.” The blue regions represent the putamen while the green regions represent the globus pallidus. The white lines represent the DBS leads with four gray regions representing individual electrode contacts. See Figure 2 for precise localization of each contact.

