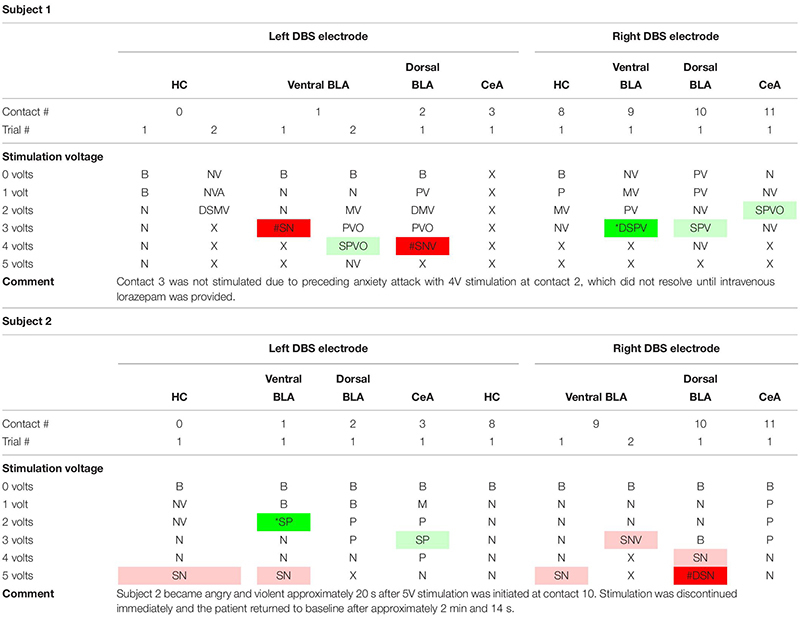
TABLE 1.
Acute stimulation effects of individual DBS electrode contacts in both subjects organized by contact stimulated and stimulation strength.
 |
Subject 1 was stimulated with a frequency of 160 Hz and an initial pulse width of 120 μs for the first stimulation trial at contacts 0 and 1 for which he experienced significant negative responses. As such, all subsequent stimulation at other contacts and for repeat stimulation of contacts 0 and 1 was performed with a pulse width of 60 μs. Subject 2 was stimulated with a frequency of 160 Hz and a pulse width of 60 μs. HC, head of hippocampus; BLA, basolateral nucleus of the amygdala; CeA, central nucleus of the amygdala; P, mild to moderate positive responses including increased happiness, euphoria, relaxation, pleasure, and other comforting sensations; N, mild to moderate negative responses including increased anxiety, anger, pain, fatigue, fear, and other uncomfortable sensations; M, mixed response; S, strong response; B, baseline; D, delayed response; V, visual symptoms including experiential phenomena such as déjà vu or sensation of familiarity; O, olfactory symptoms; A, auditory symptoms; *, the most intensely positive response(s); #, the most intensely negative response(s); X, stimulation settings that were not tested due to safety concerns including avoidance of triggering PTSD, anxiety attacks, or further discomfort at higher stimulation strengths; red shading, strongest negative response(s); pink shading, stronger negative responses; green shading, strongest positive response; light green shading, stronger positive responses.
