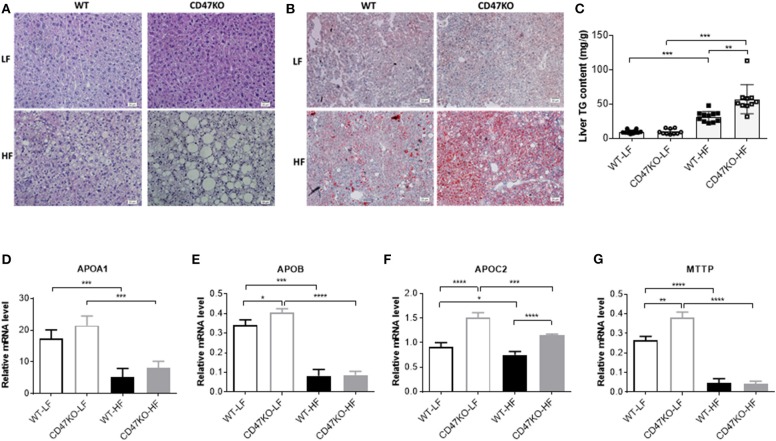
Figure 2.
Lipid accumulation and apolipoprotein gene expression in livers from wild-type (WT) and CD47KO mice fed a low-fat diet (LFD) or HFD. (A,B) Representative image of H&E (A) and Oil Red O (B; lipid droplet accumulation is shown in red) staining of liver tissues from WT and CD47KO mice fed LFD or HFD (three mice per group). Scale bar represents 20 μm. (C) Triglyceride (TG) content in liver extracts from the indicated groups of mice (n = 10–12 mice/group; combined from two independent experiments). (D–G) Expression Levels of APOA1 (D), APOB (E), APOC2 (F), and MTTP, which were determined by quantitative real-time PCR and normalized to β-actin (n = 4 per group). Data are presented as mean ± SD. *p < 0.05; **p < 0.01; ***P < 0.001; and ****P < 0.0001.

