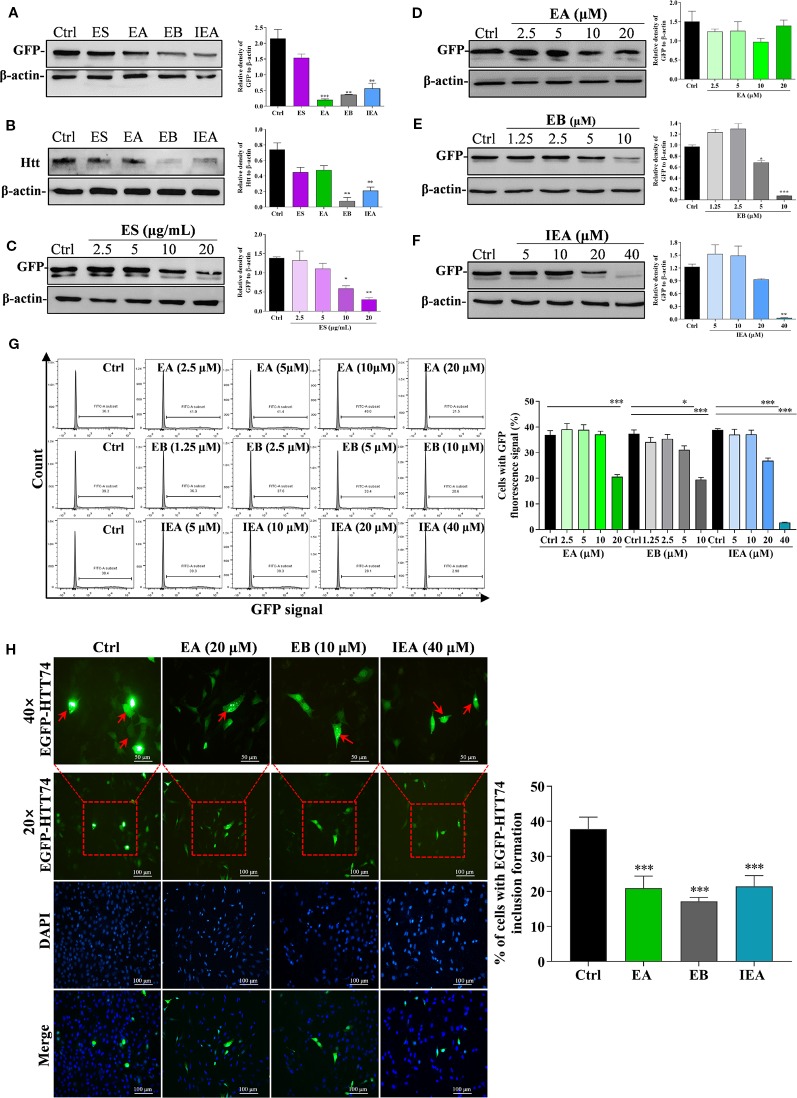
Figure 3.
ES, EA, EB, and IEA enhance the clearance of mHtt in HT22 cells. HT22 cells transfected with EGFP-HTT74 were treated with ES (40 μg/mL), EA (20 μM), EB (10 μM), and IEA (40 μM) for 24 h, the protein level of GFP (A) and mHtt protein (B) was then detected by using Western blot. HT22 cells transfected with EGFP-HTT74 were treated with ES (2.5, 5, 10, and 20 μg/mL) for 24 h (C), EA (2.5, 5, 10, and 20 μM) for 24 h (D), EB (1.25, 2.5, 5, and 10 μM) for 24 h (E), or IEA (5, 10, 20, and 40 μM) for 24 h (F). After treatment, the cells were harvested and the level of mHtt protein was detected by using Western blot with GFP antibody. The bar chart indicates the relative density of GFP or Htt to β-actin; bars, S.D. *P ≤ 0.05, **P ≤ 0.01, ***P ≤ 0.001. (G) HT22 cells transfected with EGFP-HTT74 were treated with EA, EB and IEA at the indicated concentrations for 24 h. Cells were then collected and analyzed by flow cytometry using the FITC channel. Bar chart indicates the percentage of cells with GFP signal; bars, S.D. *P ≤ 0.05, ***P ≤ 0.001. (H) HT22 cells transfected with EGFP-HTT74 were treated with EA, EB and IEA at the indicated concentration for 24 h. After treatment, the cells were fixed with 4% PFA and representative images were captured by using a fluorescence microscope (Nicon; Japan). Red arrows indicate the cells with formed EGFP-HTT74 inclusion. Magnification: 20× or 40×. Scale bar: 100 μm. Bar chart indicates the percentage of cells with EGFP-HTT74 inclusion formation; bars, S.D. ***P ≤ 0.001. The full-length Western blot images are showed in Figure S12.

