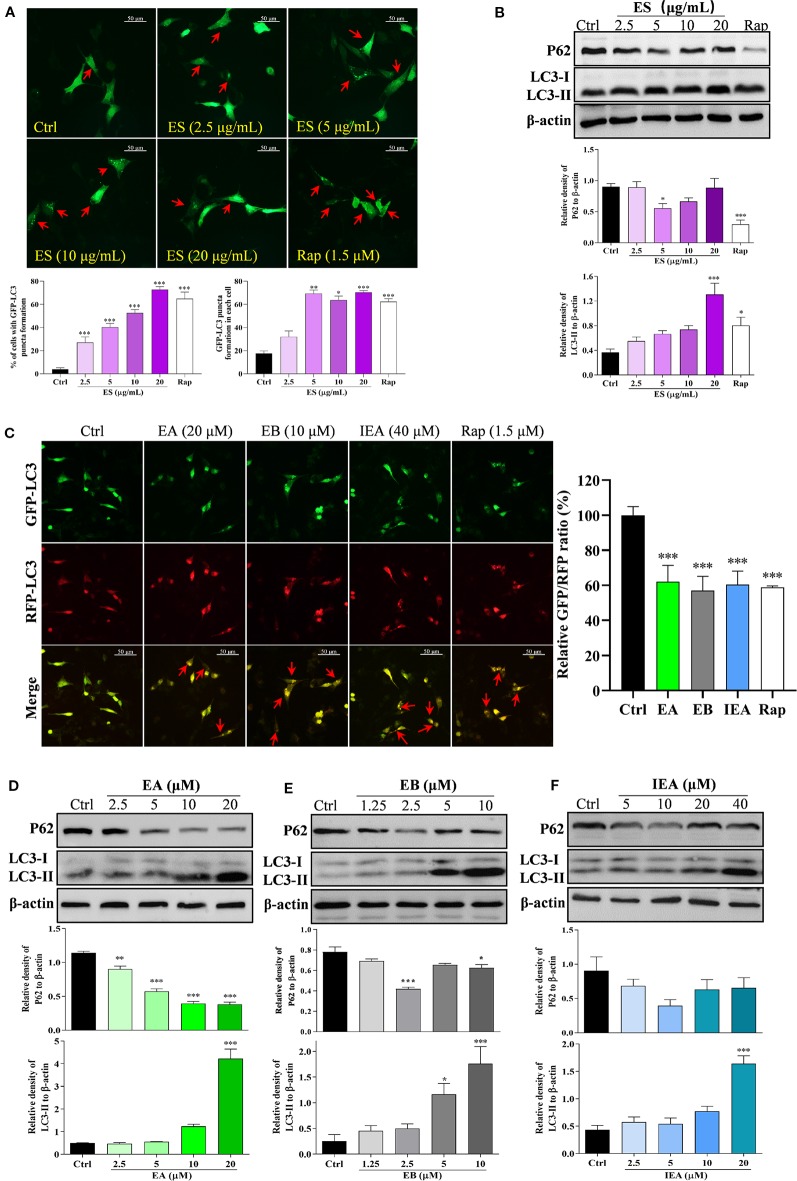
Figure 4.
ES, EA, EB, and IEA induce autophagy in HT22 cells. (A) HT22 cells transfected with GFP-LC3 were treated with ES and Rap under the indicated concentrations for 24 h. After treatment, the cells were then fixed and the representative images were captured by fluorescence microscope. Red arrows indicate the cells with formed GFP-LC3 puncta. Magnification: 40×. Scale bar: 50 μm. Bar chart indicates the percentage of cells with GFP-LC3 puncta formation and the number of GFP-LC3 puncta in each cell; bars, S.D. *P ≤ 0.05, **P ≤ 0.01, ***P ≤ 0.001. (B) HT22 cells were treated with ES and Rap under the indicated concentrations for 24 h. Cell proteins were then harvested for the Western blot analysis of P62, LC3 and β-actin. Bar chart indicates the relative expression of P62 and LC3-II to β-actin; bars, S.D. *P ≤ 0.05, ***P ≤ 0.001. (C) HT22 cells transfected with tfLC3 plasmid were treated with EA, EB and IEA at the indicated concentrations for 24 h. After treatment, cells were then fixed and the representative images were captured by fluorescence microscope. Red arrows indicate the cells with undegraded RFP-LC3 puncta. Magnification: 40×. Scale bar: 50 μm. Bar chart indicates the relative ratio of GFP/RFP; bars, S.D. ***P ≤ 0.001. HT22 cells were treated with EA (D), EB (E), and IEA (F) at the indicated concentrations for 24 h. Cell proteins were then harvested for the Western blot analysis of P62, LC3 and β-actin. Bar chart indicating the relative expression of P62 and LC3-II to β-actin; bars, S.D. *P ≤ 0.05, ***P ≤ 0.001. The full-length Western blot images are showed in Figure S13.

