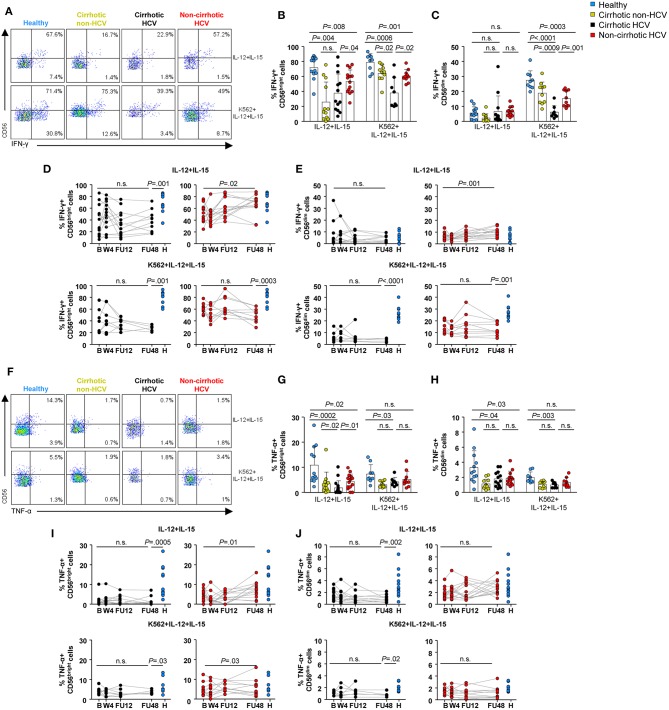
Figure 6.
NK cell cytokine production was not restored in HCV patients with cirrhosis 1 year after the end-of-therapy. Representative flow cytometry plots (A) and baseline frequencies of IFN-γ+ CD56bright (B) and CD56dim (C) cells after IL-12 and IL-15 or IL-12, IL-15, and K562 stimulation. Longitudinal analysis of IFN-γ-producing CD56bright (D) and CD56dim (E) cells in cirrhotic and non-cirrhotic HCV patients. Representative flow cytometry plots (F) and baseline frequencies of TNF-α+ CD56bright (G) and CD56dim (H) cells after IL-12 and IL-15 or IL-12, IL-15, and K562 stimulation. Longitudinal analysis of TNF-α-producing CD56bright (I) and CD56dim (J) cells in cirrhotic and non-cirrhotic HCV patients. P-values were determined during the longitudinal analysis by using mixed models for repeated measurements, and P-values between healthy controls and the different time point were determined by Mann–Whitney U test; n.s., not significant.

