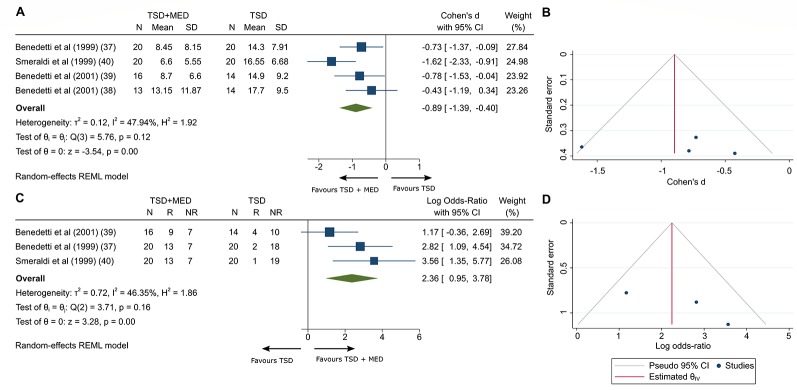
Figure 3.
Clinician-rated depressive symptoms at the 10th day adding medication to TSD (A) and the funnel plot of included studies (B). Clinician remission at the 3rd month (C) and the funnel plot of included studies (D). TSD, Total sleep deprivation; MED, Medication; CI, Confidence interval; SD, Standard deviation; N, Sample size; R, Remission; NR, No remission; Tests of heterogeneity, I2 and Q statistic were included. REML, Restricted maximum likelihood.

