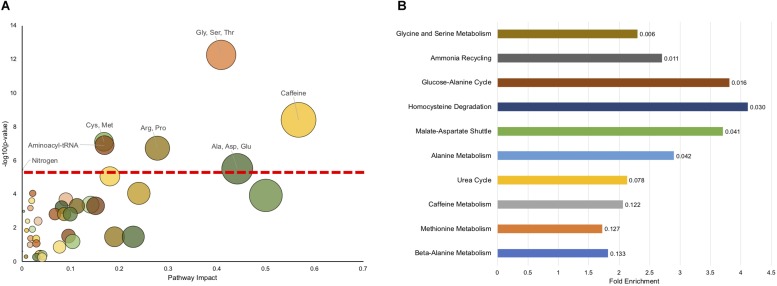
FIGURE 3.
Pathway enrichment shows significant enrichment in metabolic pathways related to amino acid metabolism. (A) The impact on a pathway (Pathway Impact) for a given KEGG pathway is shown on the x-axis, and the −log(p) of the uncorrected p-value is presented on the y-axis. The dashed horizontal red line represents the p < 0.05 cutoff after FDR correction. The pathways that are significant (FDR < 0.05) are labeled. (B) MSEA overrepresentation analysis displaying the top 10 enriched pathways. The length of the bar is the fold enrichment of the pathway with the scale presented at the bottom. The numbers indicated the raw p-value for enrichment.

