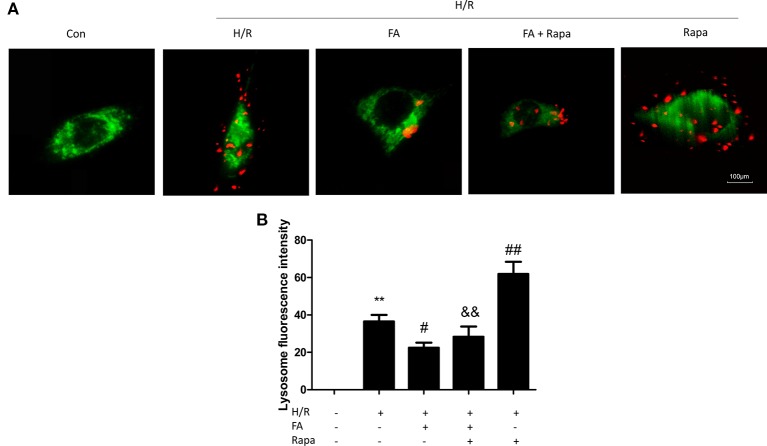
Figure 3.
Ferulic acid (FA) inhibited mitophagy. (A) Mitophagy was detected by using MitoTracker Green and LysoTracker Red staining. (B) Quantitative analysis of lysosome fluorescence intensity. At least 50 cells from three independent experiments for each group were included; the counts were averaged. Scale bar: 100 µm. Data were expressed as the mean ± SEM (n = 3). **P < 0.01 versus the control group. #P < 0.05 and ##P < 0.01 versus the hypoxia/reoxygenation (H/R) group. &&P < 0.01 versus the rapamycin group.

