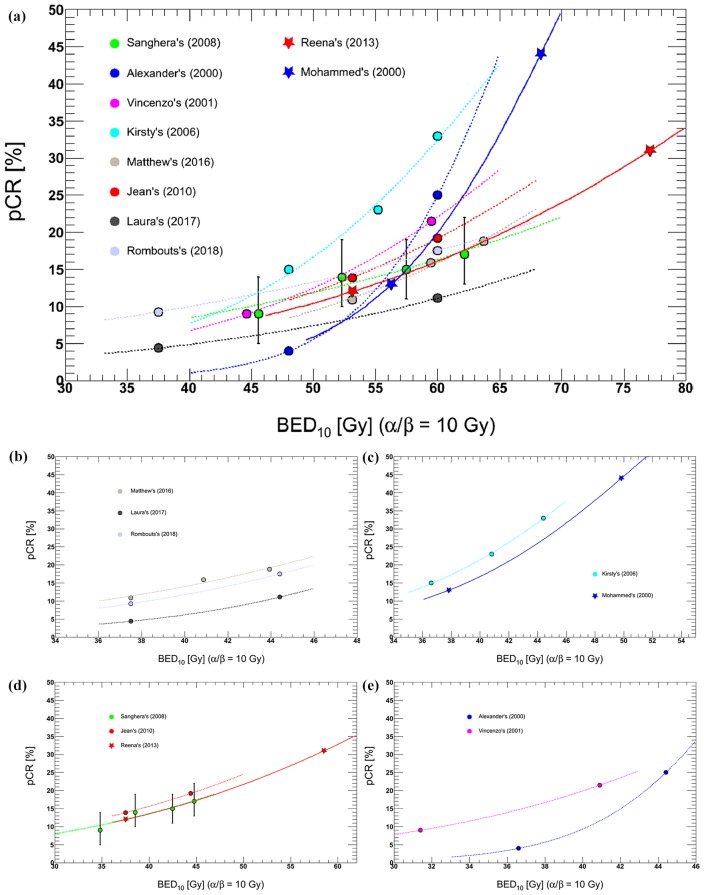
Figure 3.
Comparison of reported dose–response relationships between BED10 and pCR.
Studies on preoperative CRT were included if they were conducted to treat rectal cancer, comparing conventional dose with intensified dose. Data from eight comparative studies were analyzed. Logistic response curves fitted for each study. (a) BED10 without OTT correction. D50 (the dose required for 50% response) ranged from 68.3 to 108.0 Gy, and the normalized dose–response gradient G50 at D50 ranged from 0.87 to 2.42 (b, c, d, e) BED10 with OTT correction; (b) three studies conducted by Hall, Kairevičė, and Rombouts4,75,118 showed very close results; D50 was 59.0 ± 13.5 Gy, 58.8 ± 19.0 Gy, and 59.1 ± 13.8Gy, but G50 was 1.40 ± 0.18, 2.12 ± 0.41, and 1.56 ± 0.21, separately; (c) two studies performed by Mohiuddin and Wiltshire79,115 demonstrated that D50 was 49.8 ± 5.5 Gy and 51.6 ± 4.1 Gy, and G50 was 1.65 ± 0.12 and 1.78 ± 0.10; (d) Three groups26,113,114 also got the similar results. D50 was 70.1 ± 15.4 Gy, 70.0 ± 22.3 Gy and 72.6 ± 8.0 Gy, and G50 was 1.08 ± 0.12, 0.98 ± 0.16 and 1.03 ± 0.07, separately; and (e) No similar results were observed.
BED, biologically effective dose; OTT, overall treatment time, pCR, pathological complete response.

