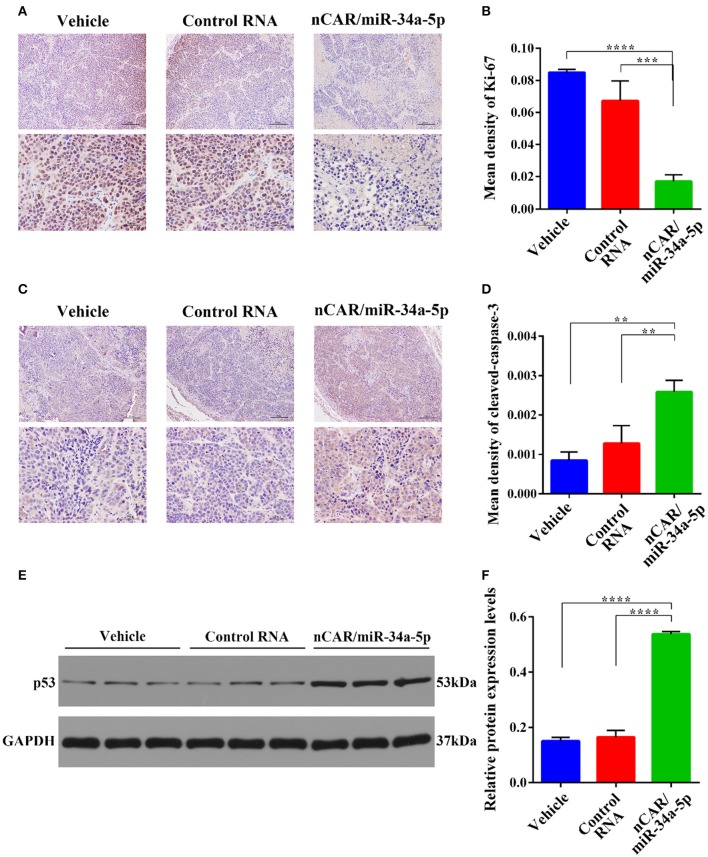
Figure 5.
Immunohistochemistry and Western blot analyses of xenograft tumor tissues from different treatment groups. (A) The proliferative biomarker Ki-67. Upper scale bar: 200 μm; lower scale bar: 50 μm. (B) Quantitative comparison of Ki-67 levels revealed that bioengineered nCAR/miR-34a-5p greatly inhibited cell proliferation in xenograft tumors, as compared to control RNA (P < 0.001, one-way ANOVA) or vehicle treatment (P < 0.0001, one-way ANOVA). (C) The apoptotic biomarker cleaved-caspase-3. Upper scale bar: 200 μm; lower scale bar: 50 μm. (D) Quantitative comparison of cleaved-caspase-3 levels demonstrated that nCAR/miR-34a-5p treatment largely induced apoptosis in xenograft tumors, compared with either control RNA or vehicle treatment (P < 0.01, one-way ANOVA). (E,F) Western blot analyses revealed a significant increase of p53 protein level in tumor tissues following the treatment with nCAR/miR-34a-5p, as compared to control RNA and vehicle (P < 0.0001, one-way ANOVA). Values are mean ± SD of triplicate treatments. *P < 0.05; **P < 0.01; ***P < 0.001; ****P < 0.0001.

