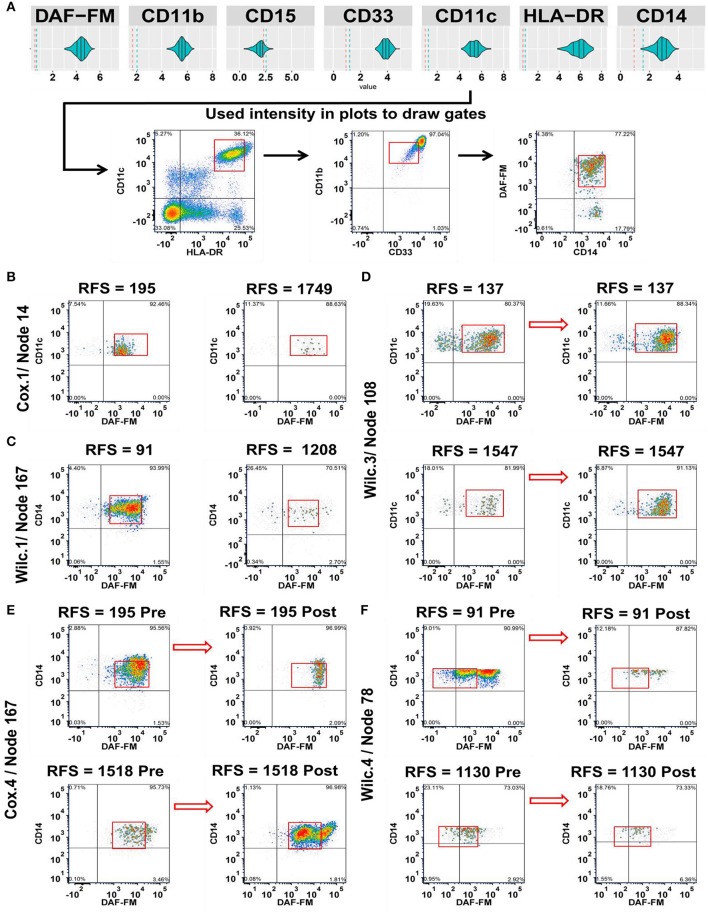
Figure 3.
Integration of the MPATR output for the myeloid markers and delineation of cellular subsets associated with relapse-free survival (RFS) or treatment effects. (A) Unsupervised gating performed through the use of the myeloid marker median fluorescence intensity measurements generated from MPATR violin plots (as shown for node 167; mature monocytes) to delineate populations that were not easily seen within bivariate plots. (B) Cox.1 analysis: Representative density plots of a population of developing monocytes (node 14 = HLA-DR+CD33−/lo or+/loCD11b+CD11c+ CD14−/loDAF-FM+, hazard ratio = 3.592, p = 0.013) at pre-treatment stage of short and long term RFS samples. (C) Wilc.1 analysis: Mature monocytes that are CD33+CD14+ (node 167 = HLA-DR+CD33+CD11b+CD11c+CD14+DAF-FM+; RFS ≤ 1 year, mean = −8.394, SD = 1.168; RFS > 1 year, mean = −9.340, SD = 1.125; p = 0.028) analyzed at pre-treatment stage in both short and long RFS samples. (D) Wilc.3 analysis: Density plots of dendritic cells (node 108 = HLA-DR+/loCD33−/lo or+/loCD11b+CD11c+ DAF-FM+, mean = 0.370, p = 0.022) before and after ipilimumab treatment from representative short and long RFS samples. (E) Cox.4 analysis: A subset of mature monocytes (node 167 = HLA-DR+CD33+CD11b+CD11c+CD14+DAF-FM+; hazard ratio = 0.488, p = 0.021) were analyzed at both stages of treatment from short and long term RFS samples. (F) Wilc.4 analysis: Whereas, another subset of mature monocytes (node 78 = HLA-DR+CD33+CD11b+CD11c+CD14+/loDAF-FM+/lo; RFS ≤ 1 year, median = −1.289), (RFS > 1 year, median = −0.243; p = 0.037) demonstrated a unique trend of NO expression at post ipilimumab therapy with samples of long RFS.

