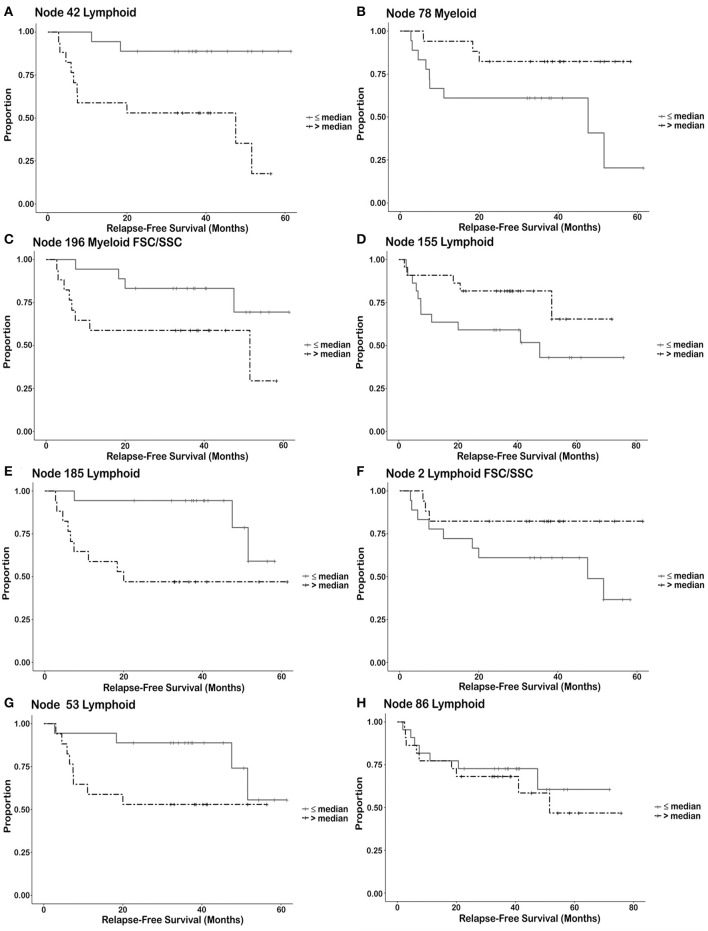
Figure 4.
Kaplan Meier survival curves illustrating types of relationships between immune cell subsets and relapse free survival. Each node is divided into two groups or strata. A node from a particular patient is placed in the strata having greater than the median number of events for the population (all trial patients) or is placed in the strata having less than or equal to the number of events in the entire population for the node. Once these individual cell events are placed into these two groups, Kaplan Meier plots describe each group as a function of relapse free survival. (strata = ≤ median number of events/node, >median number of events/node). Discussion of these different groups can be found in results. (A,B) Utilization of the number of immune cells as a cut-off for predicting response. (A) Node 42 Lymphoid–NK cells (post-pre). (B) Node 78 Myeloid–Monocytes (post-pre). (C,D) Number of immune cells known to be associated with biology but may not be useful as a biological cut-off without additional information. (C) Node 196 Myeloid FSC/SSC–MDSC (post-pre). (D) Node 155 Lymphoid–Effector T cells (pre). (E,F) The survival curves separate after a prolonged period of time. (E) Node 185 Lymphoid–αβ T cells (post-pre). (F) Node 2 Lymphoid FSC/SSC–Tregs (post-pre). (G) The survival curves merge after a prolonged period of time indicating that relapse may be prolonged in these patients [Node 53 Lymphoid–CD8 memory/naïve T cells (post)]. (H) The survival curves show no difference, but there is a difference in the continuous variable (non-dichotomized) that may necessitate a different cut-off value for biomarker determination [Node 86 Lymphoid–B Lymphocytes (pre)].

