
Fig. 1.
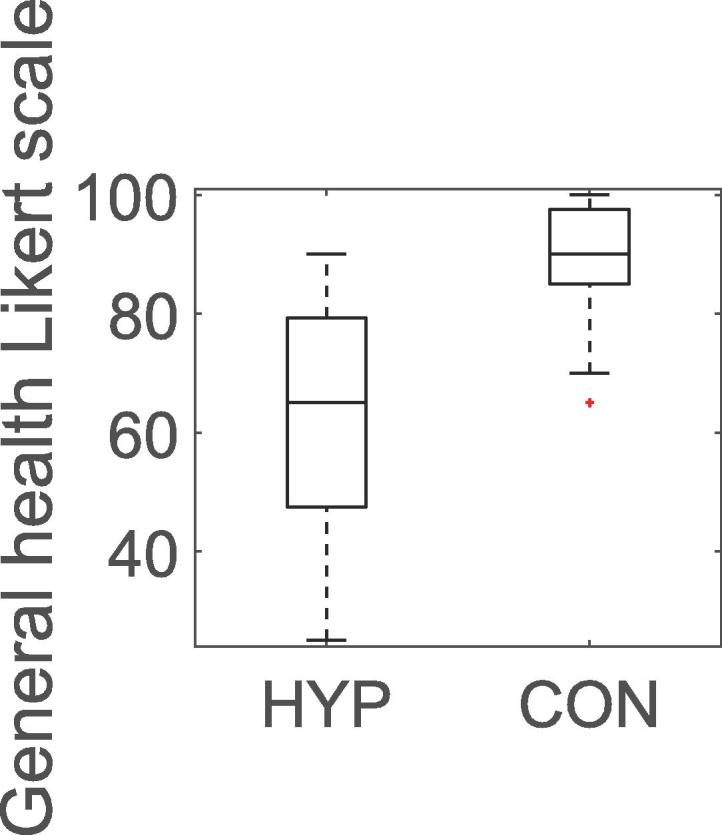
Boxplot of general health (0–100) in hypothyroid subjects (HYP) and healthy controls (CON). The box indicates median (Md) values of 65 vs 90, respectively, p < 0.001, and 25th and 75th percentiles. The whiskers extend to all data, except potential outliers.