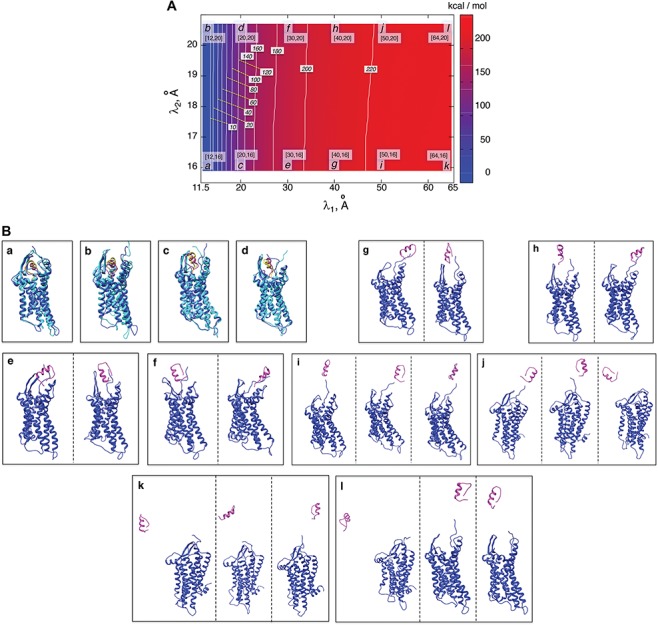
Fig. 4.

(A) Free-energy landscape expressed by  (
( . Virtual states
  and
and  are converted to
  and
and  , as presented in the caption of Fig. 3. The lowest
  is set to 0 kcal/mol. Numbers labeled near contour liners are their
  values in units of kilocalories per mole. Conformations taken from positions labeled
  ,
,  , … and
  are displayed in panel (B). Values
  are coordinates of the labels in angstrom units. (B) Snapshots taken from labeled positions in panel (A). Each of labels
  ,
,  ,
,  , and
, and  involves two snapshots, where magenta ET1 and blue hETB construct one snapshot, and yellow ET1 and cyan hETB constitute the other. Two snapshots are displayed for each of
  ,
,  ,
,  , and
, and  differently to clarify the structural variety. Three snapshots are shown for each label of
  ,
,  ,
,  , and
, and  .
.
