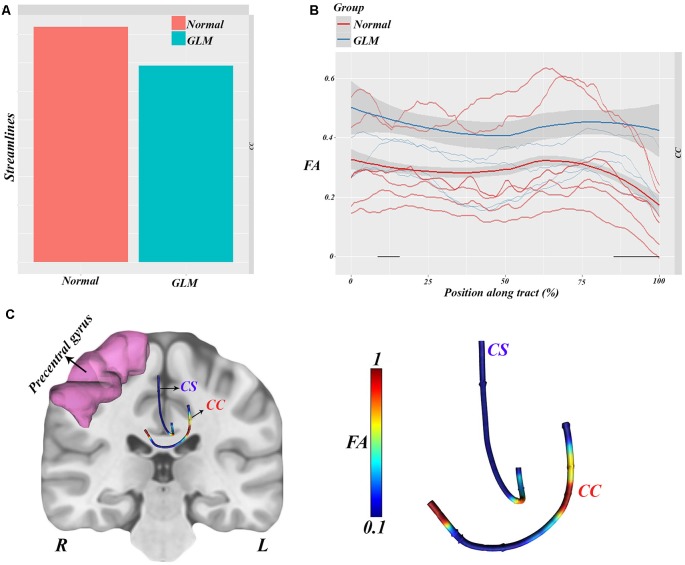
Figure 4.
Along-tract statistical analyses showing significantly lower streamlines in glioma patients relative to normal subjects (A). FA values along CC were analyzed between groups, which showed a remarkable difference (higher FA along streamlines) in patients vs. controls (B). All the statistical features visualized show the CC implication as a hub between hemispheres (C).

