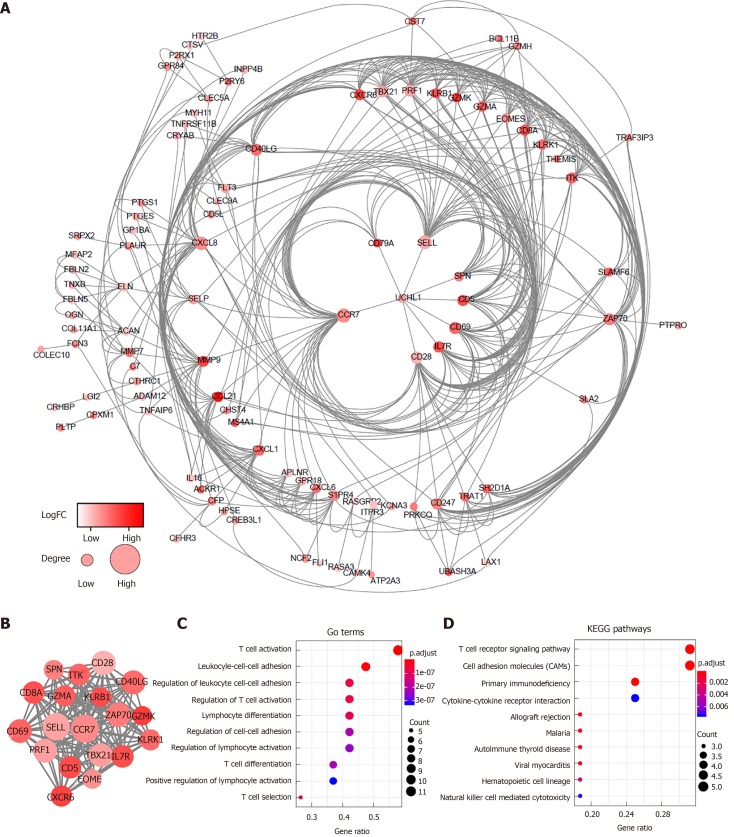
Figure 3.
Protein-protein interaction network and module analysis of prognosis-related differentially expressed genes. A: Protein-protein interaction (PPI) network of all 147 differentially expressed genes; B: PPI network of the module. The color of nodes in the PPI network reflects the log (FC) value of the Z score of gene expression, and the size of nodes means the number of interacting proteins with the designated protein; C and D: Gene ontology terms and KEGG pathway analysis for the genes in the module. GO: Gene ontology; KEGG: Kyoto Encyclopedia of Genes and Genomes.

