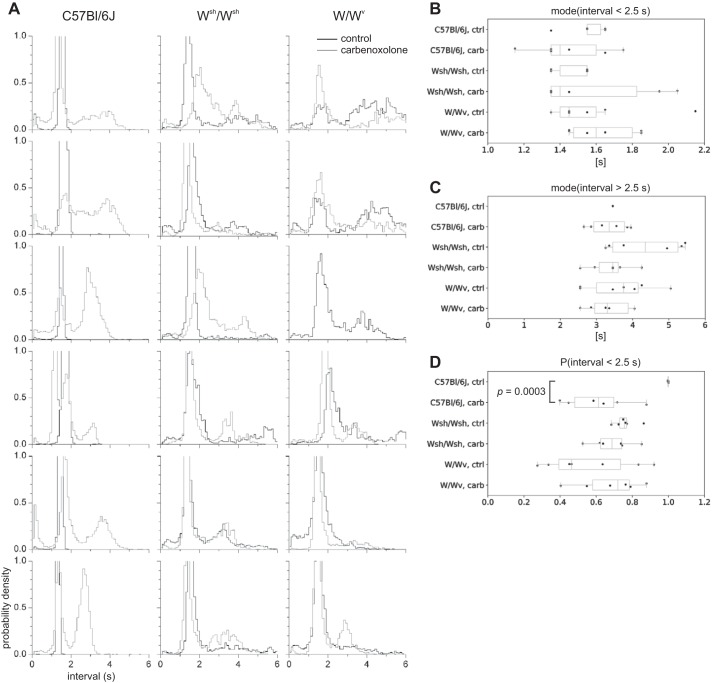
Fig. 8.
Contraction interval distributions in wild type and W mutants. A: contraction interval distributions for 18 mice—6 female C57BL/6J (left), 6 female Wsh/Wsh (center), and 6 female W/Wv (right)—before (black) and after (gray) carbenoxolone. Every panel has the same interval (x) and probability density (y) scale, as indicated at bottom left. B–D: statistics of intervals for each strain, before and after carbenoxolone, shown as box-whisker plots: values for each intestine (points), median (central line), lower to upper quartile (box), and range (whiskers) are shown. B: mode of intervals < 2.5 s. C: mode of intervals > 2.5 s. D: probability of interval being <2.5 s. Comparisons were made between all categories [strain and control (ctrl) to carbenoxolone (carb)] by unpaired Student’s t test. Only the shown comparison (probability of interval > 2.5 s, from wild-type control to wild-type carbenoxolone) had P < 0.05. Note that in C C57BL/6J control n = 2, because 4 intestines had no intervals > 2.5 s.

