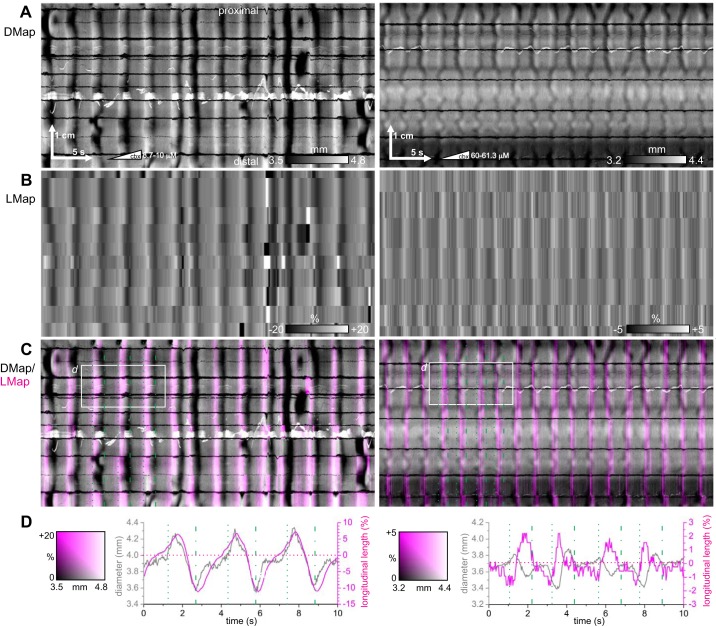
Fig. 10.
Longitudinal relaxation during stripes. Spatiotemporal maps of changes in diameter (DMaps, A) for 2 different intestines (left and right), corrected for longitudinal movement, with corresponding spatiotemporal maps of longitudinal contraction (LMaps, B), DMap/LMap grayscale/magenta overlay (C), and plots of average diameter and longitudinal extension (D) for the areas indicated in C. The intestines clearly extended (magenta stripes) at each stripe. Leading and trailing edges of each stripe are indicated by dotted and dot-dashed green lines in C and D. Left: female CD-1, perfused lumen, 2 μM/min carbenoxolone. Right: female CD-1, perfused lumen, 2 μM/min carbenoxolone. Representative of 6 experiments.

