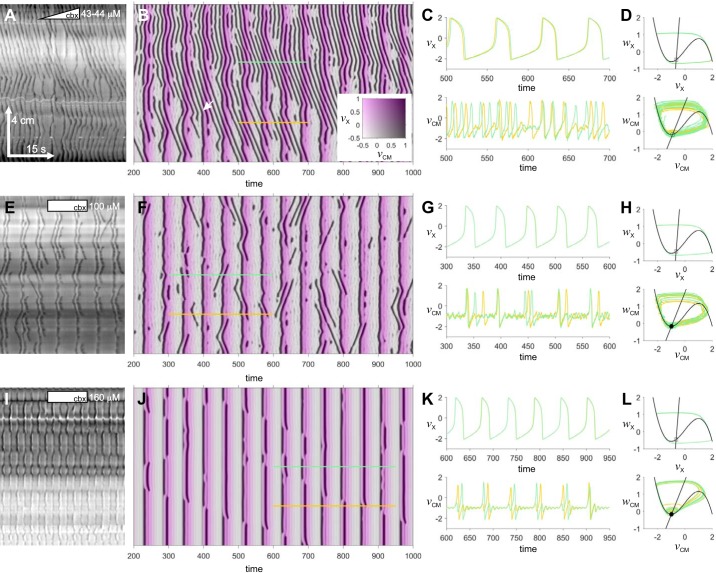
Fig. 13.
Two-chain Fitzhugh–Nagumo (FN) model. Examples of pinstripe patterns in the small intestine (A, E, and I) and in the 2-chain FN model (B, F, and J). Model parameters are given in Table 1. The model maps are color composites showing the membrane potential of the circular muscle (vCM, grayscale) and X (vX, magenta scale). The white arrow in B indicates a chevron wave suddenly changing velocity into a stripe. C, G, and K: time series of vX and vCM along the colored lines indicated in the corresponding spatiotemporal maps on left. D, H, and L, the equivalent trajectories in state space. The black lines are the nullclines of the proximal FN system (straight line = w, knee = v). Equilibria at the nullcline intersections are plotted (circle = focus; square = node; filled = stable; empty = unstable). Scale in A applies to all DMaps. A: female Wsh/ Wsh, perfused, 2 μM/min carbenoxolone (cbx). E: female W/Wv, perfused, 100 μM carbenoxolone. I: female CD-1, Trendelenburg, 160 μM carbenoxolone.

