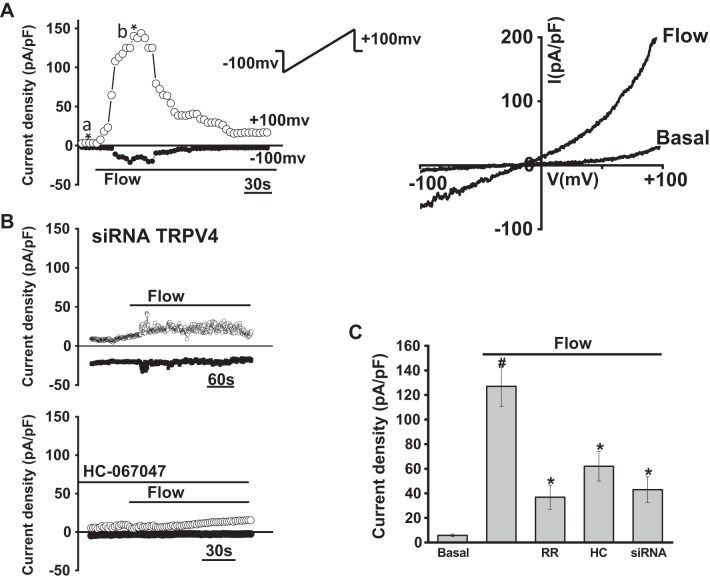
Fig. 4.
Whole cell currents were measured during basal conditions and during exposure to flow of isotonic extracellular buffer (see methods). A: representative whole cell recording of large mouse cholangiocytes (MLC). Currents measured at +100 mV (○) and at −100 mV (●) are shown. Flow exposure (shear of 0.64 dyne/cm2) is indicated by the bar. Currents activated within 20 s of onset of flow and rapidly decayed. Ramp protocols (ramp from −100 mV to +100 mV over 450 ms; shown in inset) were obtained at (a*) and (b*), representing basal and maximal currents, respectively. Current-voltage (I-V) plot shown at the right was generated from these ramp protocols during basal and flow-stimulated conditions. B: representative whole cell current recordings of MLC after transfection with transient receptor potential vanilloid member 4 (TRPV4) small interfering (si)RNA (top trace) or in the presence of the TRPV4 channel inhibitor HC-067047 (100 µM, bottom trace) indicated by the bar. C: cumulative data demonstrating flow-stimulated currents in the presence or absence of the TRPV4 inhibitors ruthenium red (RR, 10 µM), HC-067047 (HC, 10 µM), or in cells after transfection with TRPV4 siRNA (n = 9). Values represent current density (pA/pF) measured at +100 mV (n = 7~9 each). Flow significantly increases current density vs. static (basal) conditions (#P < 0.01); flow-stimulated currents were significantly inhibited (*P < 0.05).

