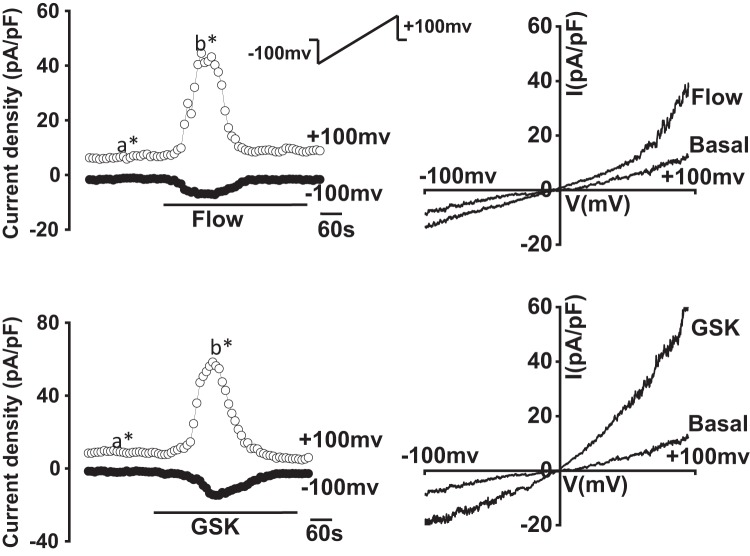
Fig. 5.
Comparison between flow- and agonist-stimulated transient receptor potential vanilloid member 4 (TRPV4) currents. Representative current traces (left) of large mouse cholangiocytes (MLC) in response to flow (shear of 0.64 dyne/cm2) (top) and after exposure to glycogen synthase kinase (GSK; 100 nM; bottom). Currents measured at +100 mV (○) and at −100 mV (●) are shown. Flow (shear of 0.64 dyne/cm2) or GSK (100 nM) exposure is indicated by the bar. Ramp protocols (inset), from holding potential of −100 mV to +100 mV over 450 ms, were obtained at (a*) and (b*), representing basal and maximal outward currents, respectively. I-V plots (right) were generated from these ramp protocols during basal and flow- (top) or GSK-stimulated (bottom) conditions as indicated.

