Fig. 6.

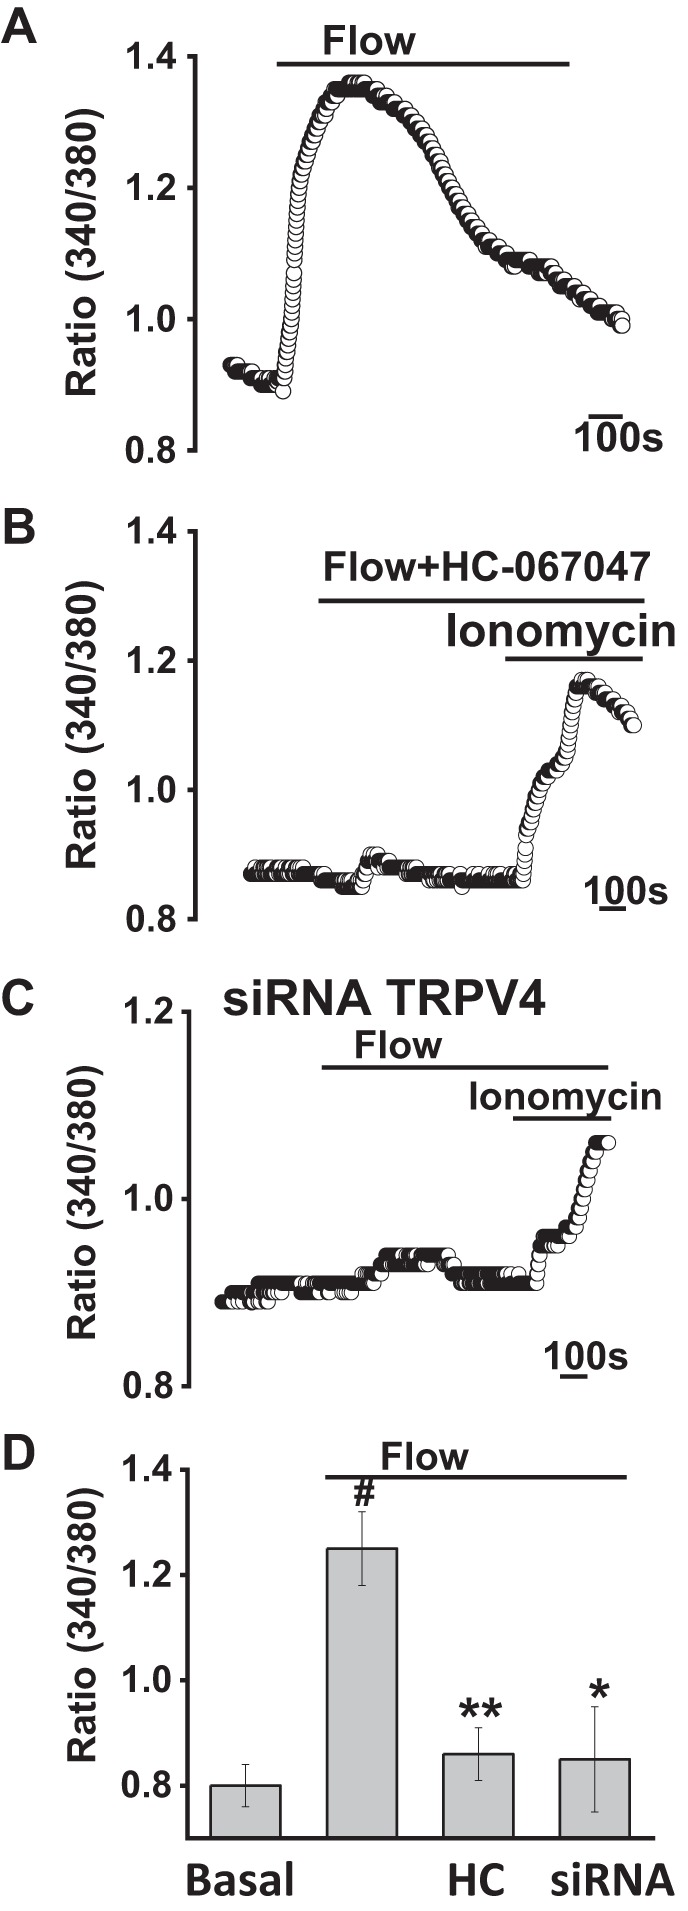
Flow-stimulated increases in intracellular calcium concentration ([Ca2+]i) in large mouse cholangiocytes (MLC). Representative Ca2+ fluorescence in response to fluid flow. MLC on coverglass were loaded with fura-2 AM and exposed to flow (2 mL/min; shear = 0.64 dyne/cm2); y-axis values represent the ratio of fluorescence at 340 and 380 nm; x-axis represents time (bar = 100 s). Control cells shown (A) vs. cells exposed to HC-067047 (HC, 10 µM; B) and after transfection with transient receptor potential vanilloid member 4 (TRPV4) small interfering (si)RNA (C). Cells were exposed to the Ca2+ ionophore ionomycin, as an internal control. D: cumulative data demonstrating the change in [Ca2+]i in response to fluid flow (shear = 0.64 dyne/cm2) in control cells (n = 78) and in the presence of HC-067047 (HC, n = 61), or after transfection with TRPV4 siRNA (n = 49). Values represent change in fluorescence ratio 340/380. Maximal increase vs. basal #P ≤ 0.01; inhibitor HC067047 vs. control **P ≤ 0.01; *P < 0.05 vs. mock transfected.
