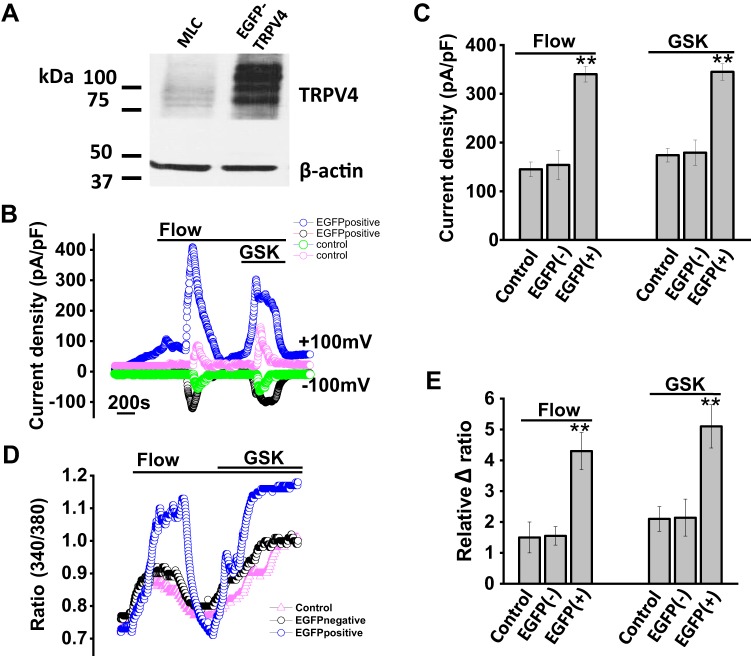
Fig. 8.
Overexpression of transient receptor potential vanilloid member 4 (TRPV4) in large mouse cholangiocytes (MLC) transfected with TRPV4-enhanced green fluorescent protein (EGFP). A: representative Western blot demonstrating TRPV4 protein levels in control cells (MLC) and after transfection with TRPV4-EGFP. Actin was used as loading control. In addition to increase of endogenous TRPV4 protein level, overexpressed EGFP-TRPV4 protein was present above. B: representative flow- and glycogen synthase kinase (GSK)-stimulated whole cell currents in control cells (open green and pink circles) and in cells after transfection with TRPV4-EGFP (open blue and black circles). C: cumulative data demonstrating maximal current density (pA/pF) in control cells, after mock transfected [EGFP(−)] and after transfection with TRPV4-EGFP [EGFP(+)] in response to flow (shear =0.64 dyne/cm2, n = 12) and GSK (100 nM, n = 15). Current density in TRPV4-EGFP transfected vs. mock transfected (**P < 0.01). D: representative calcium traces in fura-2-loaded control cells (pink triangles), mock-transfected (EGFP−, black circles) and in cells after transfection with TRPV4-EGFP (EGFP+, blue circles). The y-axis values represent the ratio of fluorescence at 340 and at 380 nm. E: cumulative data demonstrating the change in intracellular calcium concentration ([Ca2+]i) in response to fluid flow (shear = 0.64 dyne/cm2) or GSK in control cells (n = 45), cells after mock transfection (EGFP−, n = 20), and in cells after transfection with TRPV4-EGFP (n = 25). Values represent relative change in fluorescence ratio 340/380. Maximal increase fluorescence in TRPV4-EGFP transfected vs. mock transfected, **P ≤ 0.01.

