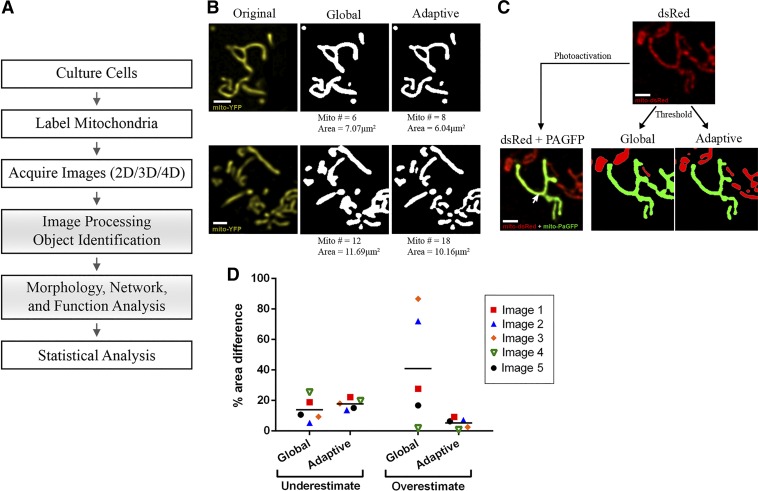
Fig. 1.
General workflow and comparison of mitochondrial identification using global vs. adaptive thresholding methods. A: schematic of the general workflow required for mitochondrial analysis by confocal microscopy. Shaded boxes represent the steps that are addressed and detailed in this paper. B: 2 representative examples of object identification using global thresholding (“default” method) vs. adaptive thresholding (radius = 1.25 μm, C = 11) on images of MIN6-cell mitochondria labeled with mitochondria-targeted yellow fluorescent protein (mito-YFP). The number of identified objects (mitochondria) and their total area are indicated below the images. Scale bar, 1 μm. C: part of the mitochondrial network in a MIN6 cell co-transfected with mito-dsRed and mitochondria-targeted photoactivatable green fluorescent protein (mito-PAGFP). Top: all mitochondria imaged in the mito-dsRed channel. Bottom left: a single mitochondrion (green) was labeled by laser-based mito-PAGFP activation at the point indicated by the arrow. Bottom right: object identification using global vs. adaptive threshold algorithms applied to the dsRed channel; in each image, the object that is identified as contiguous with the PAGFP-labeled mitochondrion is shown in green. Comparison with the original image shows that the adaptive method more accurately distinguished the photo-labeled mitochondrion, whereas global thresholding artificially merged it with adjacent mitochondria. Scale bar, 1 μm. D: quantitative comparison of the degree to which global and adaptive thresholding under- or overestimated the PAGFP-labeled mitochondrion in 5 test images. The corresponding images and details of the estimation algorithm are shown in Supplemental Fig. S3. 2D, 2-dimensional; 3D, 3-dimensional; 4D, 4-dimensional.

