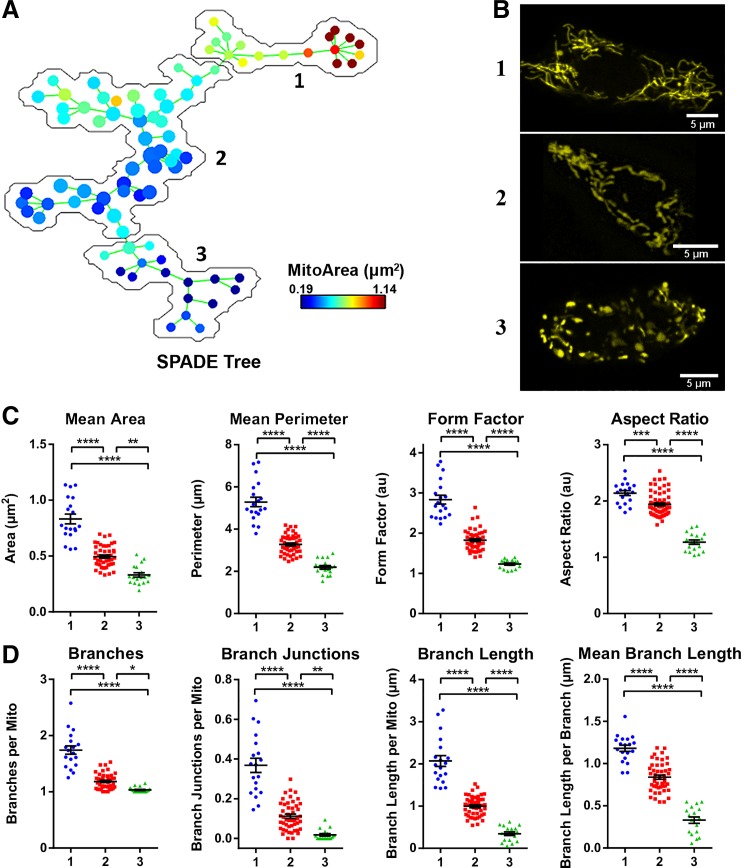
Fig. 3.
Unsupervised categorization of mitochondrial features using spanning tree progression analysis of density-normalized events (SPADE). A: a SPADE tree was generated based on the same set of 84 images used in Fig. 2 and then automatically subdivided into 3 groups; group 1 contains 19 nodes/cells, group 2 contains 47 nodes/cells, and group 3 contains 18 nodes/cells. B: representative images extracted from each of the 3 SPADE-generated groups. C and D: comparison of the mitochondrial morphology and network parameters between the 3 SPADE-identified cell groups. All data are represented by means ± SE. *P < 0.05, **P < 0.01, ***P < 0.001, and ****P < 0.0001 as determined by 1-way ANOVA with Sidak post hoc test; n = 84 images.

