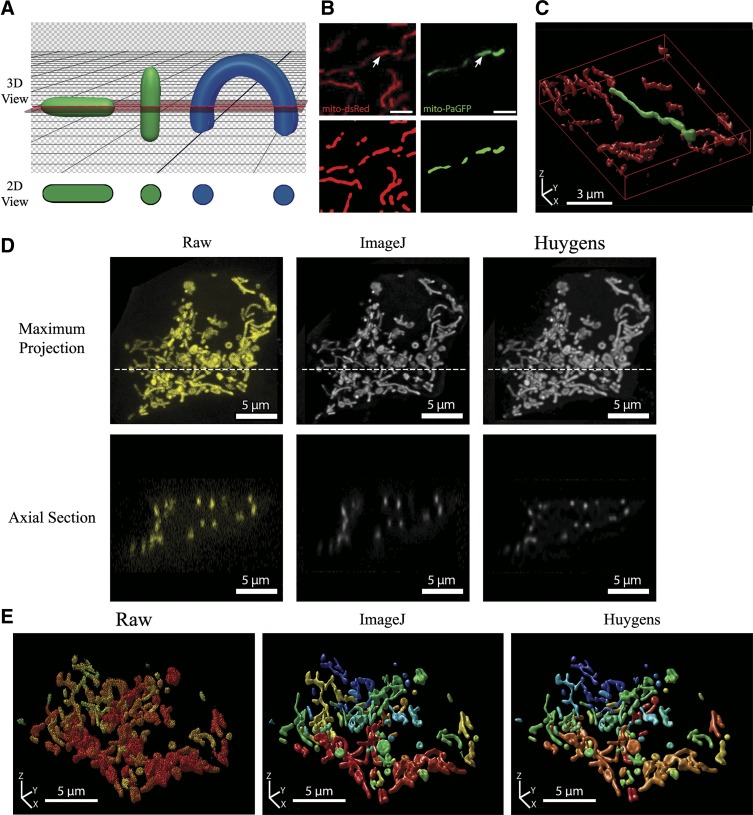
Fig. 4.
Limitations of 2-dimensional (2D) morphometric analysis and the importance of deconvolution for the quality and accuracy of 3-dimensional (3D) mitochondrial analysis. A: schematic illustrating the effect of object orientation in 3D space on the image capture in a horizontal 2D slice. The apparent 2D morphology of the same tubular object (shown in green) will depend on its orientation relative to the confocal plane. If a curved object (shown in blue) intersects the confocal plane at several locations, it will erroneously be identified as separate objects. B: MIN6 cells were co-transfected with mito-dsRed and mitochondria-targeted photoactivatable green fluorescent protein (mito-PAGFP) and photoactivation induced at the point indicated by an arrowhead. Scale bars, 3 µm. Top: 2D image of Mito-dsRed and mito-PAGFP channels after photoactivation. Bottom: objects identified after preprocessing and thresholding of the 2D cross-section. C: full 3D imaging and reconstruction (rendered using Huygens Professional software) of the same mitochondrial population shown in B. Note that the photo-labeled mitochondrion in 2D appears as a series of separate mitochondria, whereas 3D visualization correctly identifies it as 1 contiguous organelle. D: a full z-stack was acquired from a mitochondria-targeted yellow fluorescent protein (mito-YFP)-expressing MIN6 cell that was 11 μm in height. Top: maximum projection views of the z-stack before and after deconvolution. The confocal image stack was deconvolved using either ImageJ DeconvolutionLab (Richardson-Lucy algorithm) or Huygens Professional (Classical Maximum Likelihood Estimation) software for 40 iterations. Dotted line indicates the position of the axial section shown below. Bottom: axial sections (xz-plane) of the raw and deconvolved image stacks. The reduction in axial stretching of objects can be seen in the deconvolved stacks, with the best improvement achieved using the Huygens algorithm (see additional details in Supplemental Fig. S6 and Supplemental Table S1). E: 3D renderings of the z-stack before and after deconvolution with ImageJ or Huygens Professional. All 3D visualizations were generated using the Huygens 3D object renderer, with a unique color assigned to separate objects.

