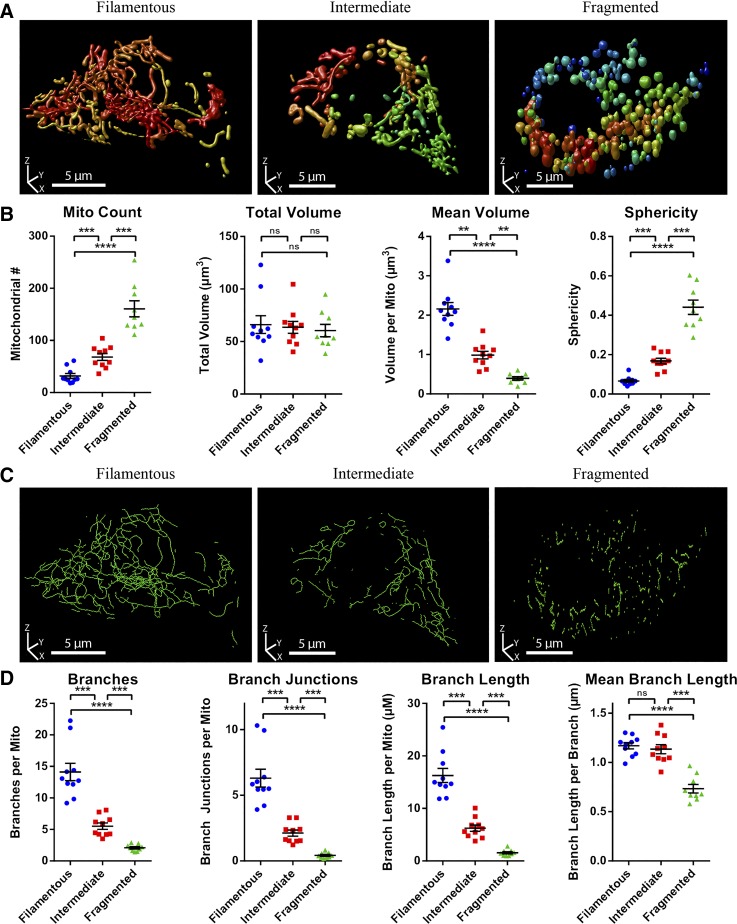
Fig. 5.
Quantitative comparison of mitochondrial morphology and network connectivity in 3D (3-dimensional). Image stacks of mitochondria-targeted yellow fluorescent protein (mito-YFP)-expressing MIN6 cells were visualized in 3D and their mitochondria manually categorized as fragmented, intermediate, or filamentous. A: 3D renderings (produced using Huygens Professional) of representative mito-YFP-expressing MIN6 cells from each of the morphological categories. B: quantitative 3D analysis and comparison of mitochondrial morphology between cells in each category. C: 3D renderings of the skeletonized mitochondrial network of the cells depicted in A. D: quantitative 3D analysis and comparison of mitochondrial network connectivity between cells in each category. All data are represented by means ± SE. **P < 0.01, ***P < 0.001, and ****P < 0.0001, as determined by 1-way ANOVA with Sidak post hoc test; n = 10 cells in each category.

