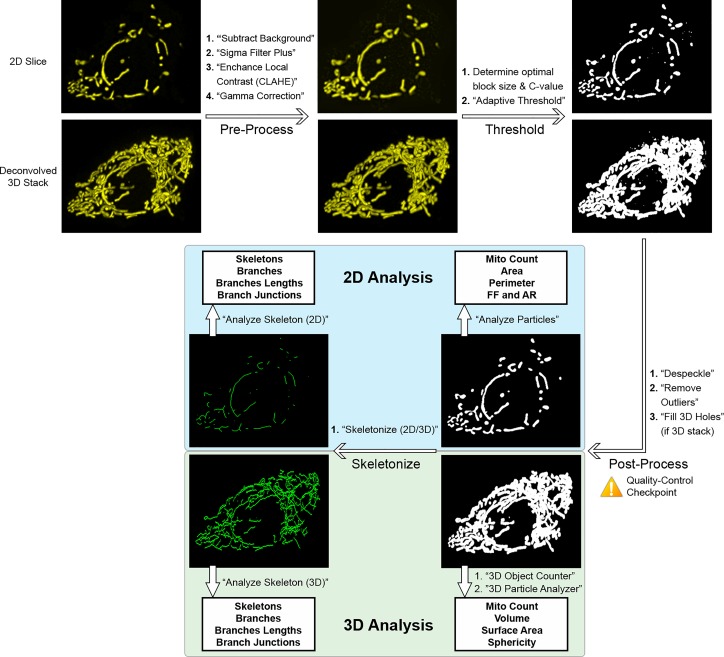
Fig. 6.
Summary of pipeline for 2-dimensional (2D) and 3-dimensional (3D) mitochondrial analysis in ImageJ/Fiji. For illustration, an image stack was acquired from a MIN6 cell expressing mitochondria-targeted yellow fluorescent protein (mito-YFP); a representative slice is shown as the 2D input and the entire stack (after deconvolution) as the 3D input. 3D stacks are represented as maximum projections here. Scale bars, 5 μm. See materials and methods and results for additional details and parameter values. AR, aspect ratio; FF, form factor.

