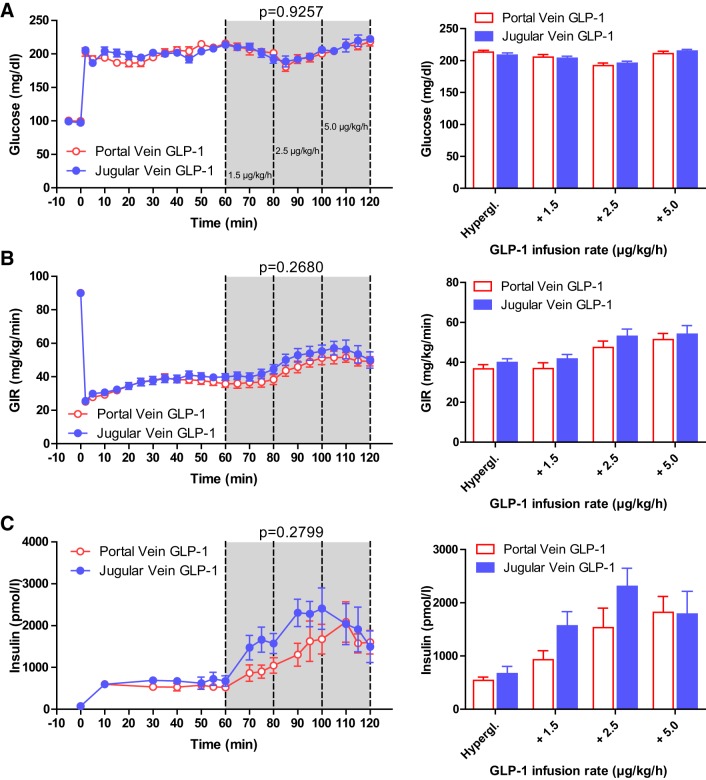
Fig. 2.
Glucose (A), glucose infusion rate (B), and arterial plasma insulin (C) during hyperglycemic clamp with inhibition of dipeptidylpeptidase 4. Line graphs (left) depict infusion of glucagon-like peptide-1 (GLP-1) into the portal (red) or jugular (blue) veins starting at time point 60 min, with increasing doses (61–80 min 1.5 μg·kg−1·h−1; 81–100 min 2.5 μg·kg−1·h−1; 101–120 min 5.0 μg·kg−1·h−1) to rats pretreated with vildagliptin. Bar graphs (right) depict average glucose (A), glucose infusion rate (B), and arterial plasma insulin levels (C) during infusion of portal (red) or jugular (blue) infusion of GLP-1. Hypergl. reflects the average values from 50 to 60 min before the GLP-1 infusion was started. There was no significant difference between insulin concentrations with portal or jugular GLP-1 infusion. All values are mean ± SE. GIR, glucose infusion rate.

