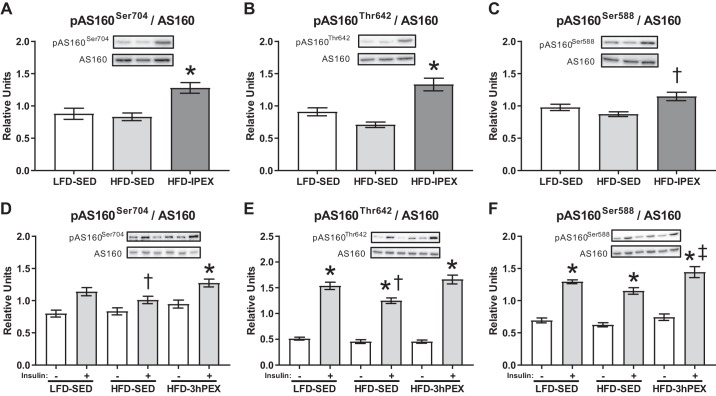
Fig. 4.
A–C: phosphorylated AS160Ser704, AS160Thr642, and AS160Ser588/AS160 immediately postexercise. Data were analyzed by one-way ANOVA. *P < 0.005, HFD-IPEX vs. both LFD-SED and HFD-SED. †P < 0.005, HFD-IPEX vs. HFD-SED. Values are expressed as means ± SEM; n = 17/group. D–F: phosphorylated AS160Ser704, AS160Thr642, and AS160Ser588/AS160 at 3 h postexercise. Data were analyzed by two-way ANOVA. *P < 0.001, insulin vs. no insulin. †P < 0.001, HFD-SED vs. both LFD-SED and HFD-3hPEX within insulin-treated muscles. ‡P < 0.01, HFD-3hPEX vs. HFD-SED within insulin-treated muscles. Values are expressed as means ± SEM; n = 10–17/group. HFD, high-fat diet; LFD, low-fat diet; SED, sedentary; IPEX, immediately postexercise; 3hPEX, 3 h postexercise.

