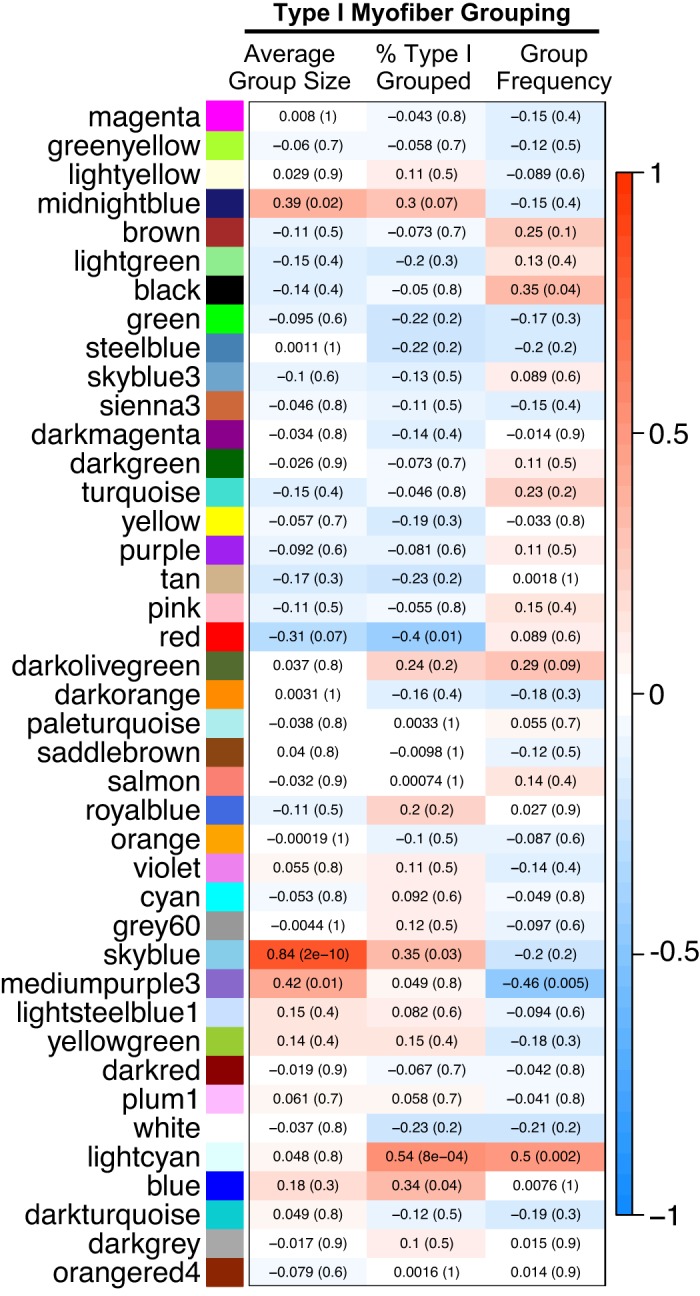
Fig. 3.

Heatmap showing Pearson correlation coefficient (and associated P value) between representative eigengenes (first principal components) for each module identified by weighted gene correlation network analysis and type I myofiber grouping traits in skeletal muscle of individuals with Parkinson’s disease (n = 12), healthy old adults (n = 12), and young adults (n = 12).
