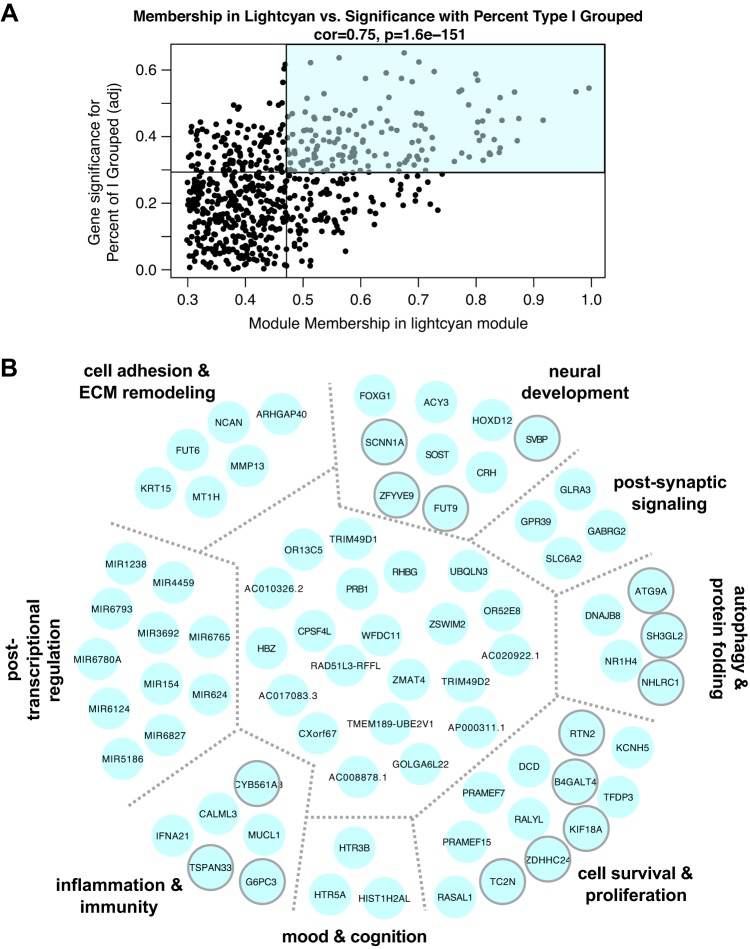
Fig. 4.
A: association for all lightcyan module members between module membership and relationship to % of type I fibers grouped across 36 samples. Lines represent median values for each parameter. Module members in the top right quadrant (shaded) were further examined for ontological relationships and common biology. B: network of genes identified as lightcyan module hubs, based on topological overlap. Manual investigation of functional annotation revealed common functions and biological phenotypes associated with clusters of genes within module (separated by gray dotted lines and further described in Supplemental Table S4). Transcripts clustered in the center (not labeled) have miscellaneous or incompletely understood functions. Transcripts outlined in gray were nominally significantly related to % of type I fibers grouped on a single-gene level (P < 0.05) with DESeq2 with a continuous variable design. ECM, extracellular matrix.

