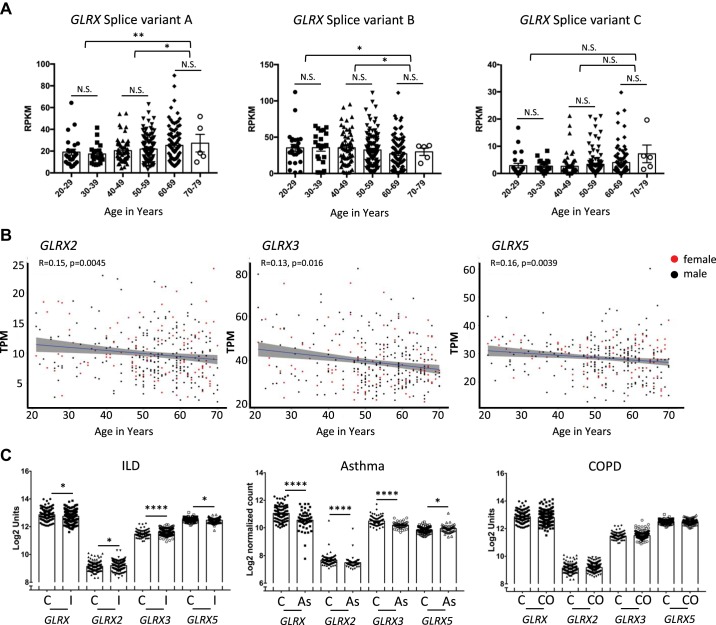
Fig. 4.
Glutaredoxins transcript levels in lung tissue from patients with lung diseases and different age groups. A: glutaredoxin-1 (GLRX) isoform-specific expression in the lung as a function of age. Splice variant A: ENST00000379979.4; Splice variant B: ENST00000237858.6; splice variant C: ENST00000512469.2. Expression of splice variants A and B demonstrates significant correlation with age, with no significant change occurring for splice variant C (n = 25, 20–29; n = 21, 30–39; n = 60, 40–49; n = 112, 50–59; n = 97, 60–69; n = 5, 70–79). Statistical significance was calculated using Welch’s t test comparing age bins 20–39, 40–59, and 60–79. *P < 0.05; ** P < 0.01. B: GLRX2, GLRX3, and GLRX5 transcripts evaluated as a function of age in nondiseased human lungs. Spearman correlation analysis revealed a significant negative correlation between age and expression of GLRX2, GLRX3, and GLRX5, with ρ values indicated in the figure. Data represent 342 normal lung specimens, 236 derived from male donors aged 21 to 70 yr (black dots), and 106 derived from female donors aged 21 to 70 yr (red dots). C: interstitial lung disease (ILD) and chronic obstructive pulmonary disease (COPD). GLRX transcripts were assessed using publicly available microarray gene expression data from the Lung Genomics Research Consortium (LGRC; http://www.lung-genomics.org) for ILD patients with a diagnosis of idiopathic pulmonary fibrosis (I; n = 255), COPD (CO; n = 219), and nondiseased control tissues (C; n = 137) (data are available in the Gene Expression Omnibus database accession no. GSE47460). [GLRX transcripts were previously reported (6) and are reformatted here for consistency]. Asthma: GLRX transcripts were assessed from publicly available RNA-seq data from RNA isolated from nasal brushing of asthmatic patients (As; n = 53) compared with healthy subjects (C; n = 97). [The full description of RNA isolation and processing, and processing of the raw RNA-seq data are published elsewhere (181)]. Results are shown as average ± SE. Statistical significance was calculated using a Mann-Whitney test. *P < 0.05, **P < 0.01, ***P < 0.001, ****P < 0.0001. A and B: RNA-seq data are from the GTExPortal v.6 (A) or v.7 (B), were analyzed (accession no. phs000424.v7.p2, 06/2018) after exclusion of patients with lung diseases (58). The Genotype-Tissue Expression (GTEx) Project is supported by the Common Fund of the Office of the Director of the National Institutes of Health, and by the National Cancer Institute, National Human Genome Research Institute, National Heart, Lung, and Blood Institute, National Institute on Drug Abuse, National Institute of Mental Health, and National Institute of Neurological Disorders and Stroke.

