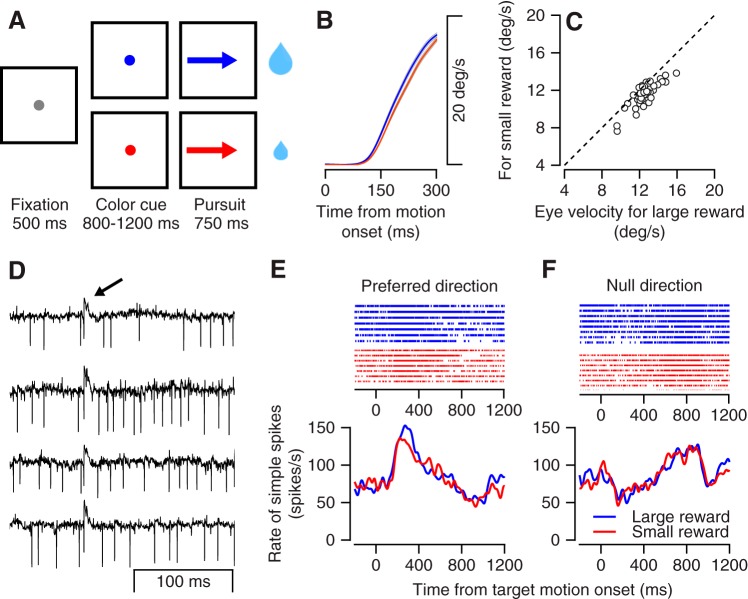
Fig. 1.
Tasks, behavior, and examples of neural responses. A: the sequence of snapshots illustrates the structure of the behavioral task. The sizes of the 2 drops of water represent the amount of reward given at the end of the trials. B: average eye speed in the large (blue) and small (red) reward conditions across all recording sessions; gray bands show the SE. C: comparison of eye velocity for the large reward condition (x-axis) and the small reward condition (y-axis) 200–300 ms after motion onset. Each dot represents 1 session. D: examples of extracellular recordings from a Purkinje cell. Each trace shows the extracellular recording aligned to the time of a complex spike. The arrow at top marks the time of the complex spikes. E and F: raster plot (top) and peristimulus time histogram (bottom) of the example Purkinje cell for the large (blue) and small (red) reward conditions: data for motion in the preferred (E) and null (opposite to preferred; F) directions, which were determined by the center of mass (vector averaging) of the first 300 ms of responses in 8 directions.

