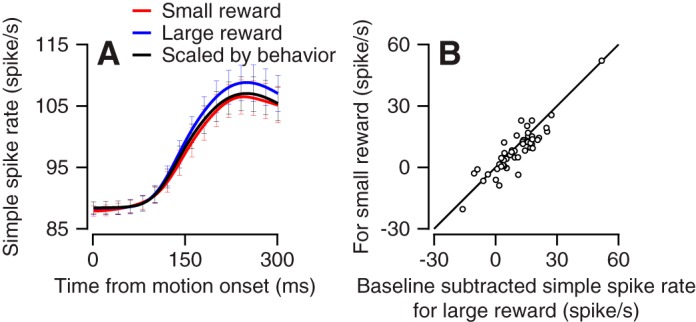
Fig. 2.

Population response of the Purkinje cells at movement initiation around the preferred direction. A: average activity of the population of neurons in the preferred direction and in directions rotated by 45°. The black line shows the prediction for the modulation in the small reward condition based on the large reward response and the behavioral effect. Error bars are presented at spacing of 20 ms and show the SE. B: cell-by-cell response to the large (x-axis) and small (y-axis) rewards. Each dot shows the average activity for the first 300 ms after target motion onset.
