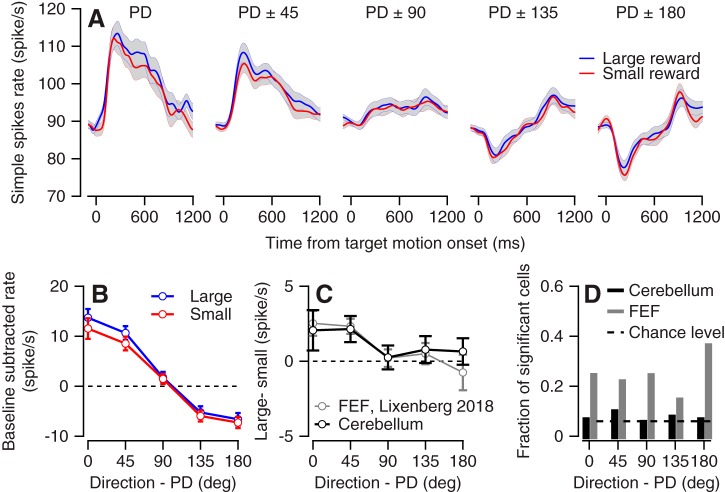
Fig. 3.
Directional tuning and reward modulations. A: population average of neural activity for the large and small reward conditions. Each plot corresponds to differences in the direction of motion from the preferred direction (PD) of the neurons. Solid lines show averages, and gray bands show the SE. B: the population tuning curve for large and small reward targets. Activity was averaged across the first 300 ms after motion onset. Error bars show the SE. C: the difference in tuning curves between the large and small rewards for the population of flocculus complex neurons (black) and for neurons in the frontal eye field (FEF) from our previous study (gray). D: the fraction of neurons that significantly encoded reward size as a function of the difference in motion direction from the PD. Black and gray bars show results for the cerebellum and FEF. FEF activity was reanalyzed to match the same number of trials and the time course (300 ms) we used for the analysis of cerebellar neurons.

