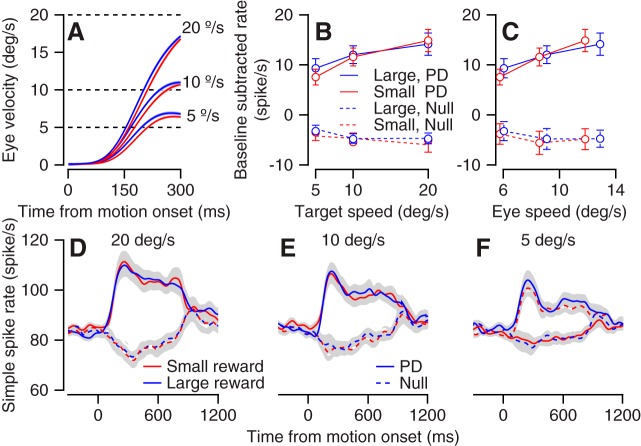
Fig. 4.
Population analysis of speed and reward modulations. A: average eye speed in the large (blue) and small (red) conditions for different speed targets. The key on right and dashed lines indicate the target speed of the corresponding trace. B and C: the population target (B) and eye (C) speed tuning for large and small reward targets in the preferred direction (PD) and the antipreferred direction (null). Error bars show the SE. The baseline firing rate was defined as the average rate at motion onset across all recorded conditions and was subtracted individually for each neuron. D–F: population average of the neural activity for the large and small reward conditions. Plots correspond to the different speed of target motion: 20°/s (D), 10°/s (E), and 5°/s (F).

