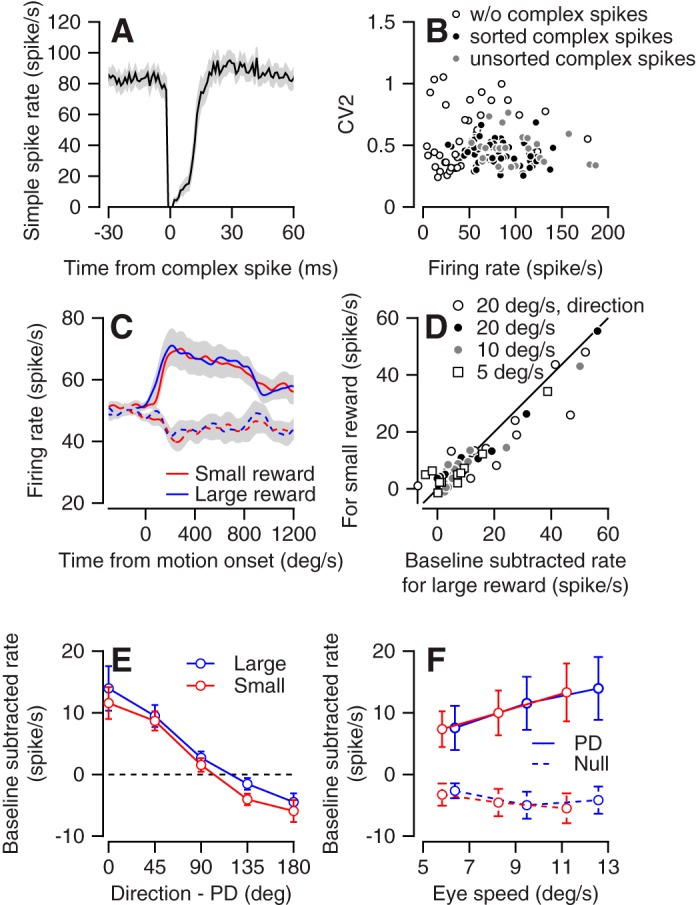
Fig. 5.

Cell identification and response of non-Purkinje cells (non-PCs). A: the simple spike firing rate (y-axis) aligned to the time from occurrence of a complex spike (x-axis). The solid line shows the average across all cells in which we identified both complex and simple spikes. B: the average firing rate (x-axis) and CV2 (y-axis) for the 500 ms before motion onset of all neurons in the study. Open, filled, and gray dots show cells in which we did not identify complex spikes, cells in which we identified and sorted complex spikes, and cells in which we identified complex spikes but were unable to sort them, respectively. C: population average activity of non-PCs in the preferred (solid) and null (dashed) directions in the large and small reward conditions in the direction tuning task. D: single-cell responses of the non-PCs in the preferred direction during the directional tuning task (direction) and at the 3 different speeds in the speed tuning task. Each symbol shows the average activity for the first 300 ms after motion onset for the large (x-axis) and small (y-axis) reward conditions. E: the population tuning curve for large and small reward targets. Activity was averaged across the first 300 ms after motion onset. PD, preferred direction. F: the population eye speed tuning for large (blue) and small (red) reward targets, in the PD and the antipreferred (null) direction. Error bars (E and F) and gray shading around traces (A and C) show the SE.
