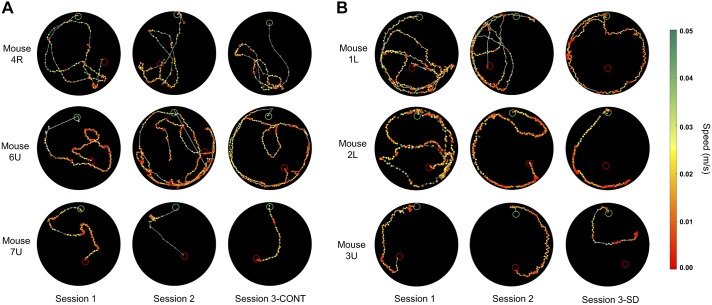
Fig. 4.
Sets of path traces from six representative mice during a single late session trial on 3 consecutive days with session 3-CONT preceded by undisrupted sleep (A; mouse 4-R, trial 17; 6-U, trial 19; and 7-U, trial 18) and session 3-SD preceded by 10 h of sleep deprivation (B; mouse 1-L, trial 17; 2-L, trial 18; and 3-U, trial 19). The mouse’s path is portrayed on the open field by color-coded points that depict speed per the green-red color spectrum legend (right). The green and red open circles represent the entry point and target destinations, respectively.

