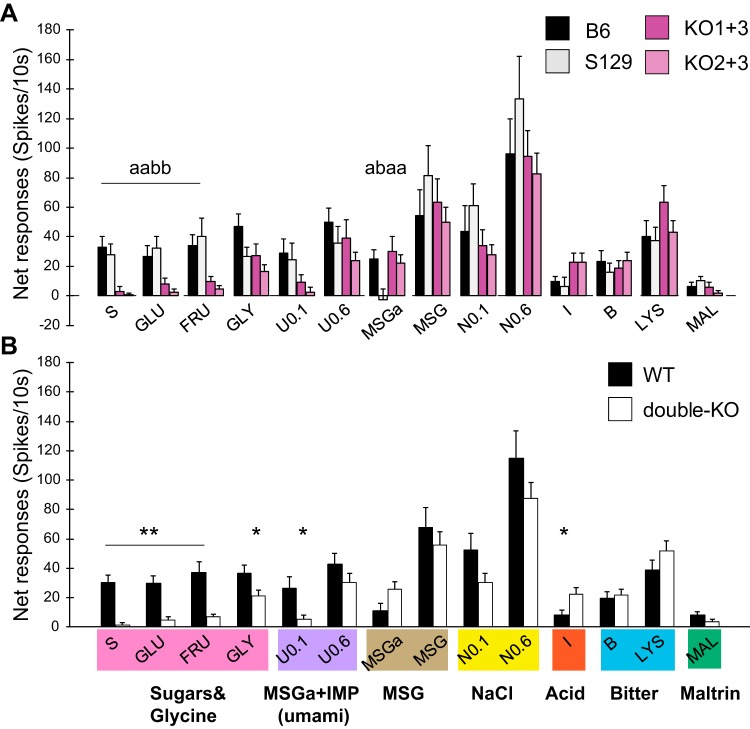
Fig. 1.
Taste responses of nucleus of the solitary tract neurons from type 1 taste receptor (T1R) double-knockout (double-KO) mice and their wild-type (WT) controls. Groups of stimuli are color coded below the x-axis in B roughly according to qualitative similarity. Note that many stimuli are qualitatively complex. A: means (±SE) net responses (spikes/10 s) across 4 strains: 2 WT (B6, n = 43; S129, n = 43) and 2 T1R-double-KO strains (KO1+3, n = 41; KO2+3, n = 53); separate ANOVAs were performed for 0.1 M umami (U0.1) and 0.1 M NaCl (N) due to 5–6 missing data points. Different letters indicate significant differences between strains for a given stimulus. B: same data set as in A but responses are pooled across WT (black filled bars) and double-KO strains (open bars). **P < 0.0001 and *P < 0.05 between WT and double-KO mice using unadjusted P values. Raw P values are P < 0.000001, 0.0001, and 0.0001 for sucrose (S), glucose (GLU), and fructose (FRU) and would withstand Bonferroni adjustment. Raw P values for 0.1 M umami (U0.1) and citric acid (I) were 0.01 and 0.01, respectively, and would not withstand this correction. B, bitter; MSGa, monosodium glutamate with amiloride; IMP, inosine 5′-monophosphate; GLY, glycine; LYS, lysine; MAL, Maltrin.

