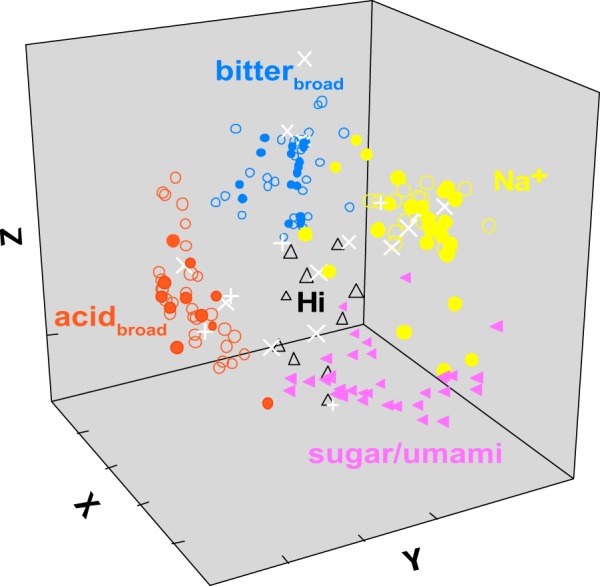
Fig. 3.

Multidimensional scaling (MDS) of all 194 wild-type (WT) and double-knockout (double-KO) neurons according to their pattern of responsiveness across 12 stimuli. Neurons are color coded to match the clusters identified in Fig. 2. Filled and unfilled shapes denote neurons from WT and double-KO mice, except for the “X” neurons, which are denoted by the white “+” symbol for the WT and “X” for double-KOs. The MDS analysis yielded a solution that agreed well with the cluster analysis. The MDS plot emphasizes the close correspondence between the WT and double-KO neurons in the Na+, bitterbroad, and acidbroad groups and the unique position of the sugar/umami cells. Although not as tightly clustered or segregated, the Hi neurons also occupy a unique location between the other groups. X neurons are dispersed throughout the space.
