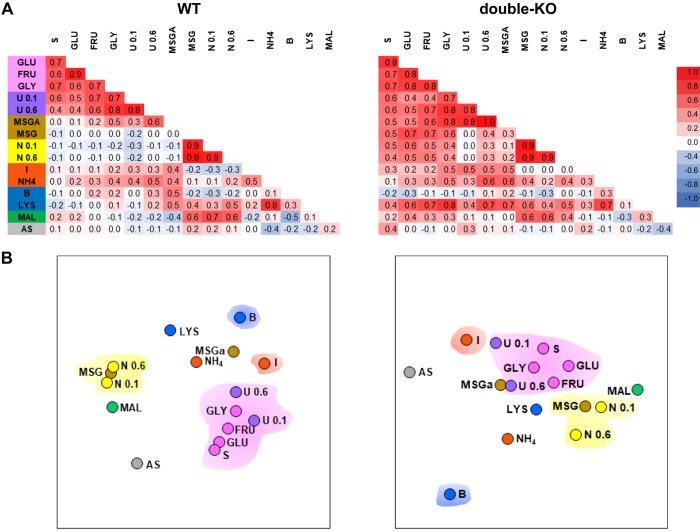
Fig. 4.
A: across-neuron correlations (Pearson’s r) for wild-type (WT; left: B6 and S129) and double-knockout (double-KO) mice (right: KO13 and KO2+3) for all taste stimulus pairs. Individual WT and double-KO strains are combined because the main conclusions are the same as for the individual strains. Magnitudes of the correlations appear as a heat map (scale bar at right). The background color for the stimulus labels at left denote tastants with a common quality (some stimuli are complex, so this is an oversimplified categorization). Note that 2 additional stimuli, ammonium chloride (NH4) and artificial saliva (AS), were included in this analysis. B: 2-dimensional MDS plots (left: WT; right: double-KO) summarizing the relationships between stimuli as defined by the across-neuron correlations. Four color clouds encompass stimuli characterized as sweet or umami (pink), salty (yellow), sour (orange), or bitter (blue). In comparison with WT mice, the sweet/umami stimulus group in the double-KOs was poorly segregated from other qualities, especially salty and sour. Maltrin lies close to the salty stimuli in both groups of mice. MSGa, monosodium glutamate with amiloride; IMP, inosine 5′-monophosphate; GLY, glycine; S, sucrose; GLU, glucose; FRU, fructose; I, citric acid; B, bitter; U, umami; N, NaCl; LYS, lysine; MAL, Maltrin.

