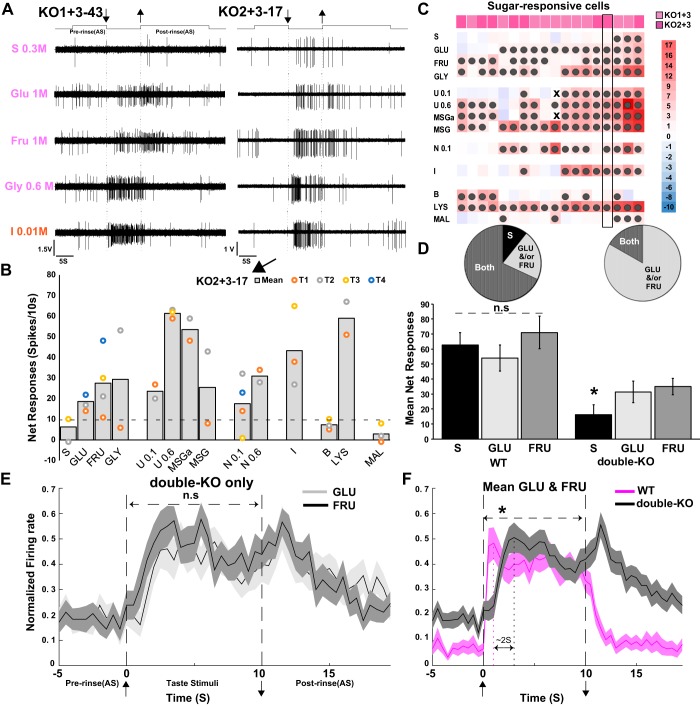
Fig. 5.
A: examples of type 1 taste receptor (T1R)-independent responses to sugars and glycine from double-knockout (double-KO) mice (left: KO1+3; right: KO2+3). Responses to citric acid are shown for comparison. Upward deflections of the line above the traces indicate artificial saliva flow. Arrows denote stimulus onset and offset. For both neurons, responses to monosaccharides are larger than to sucrose. B: mean net responses from the KO2+3 neuron shown in A (right) for the entire stimulus array. Individual trials are colored dots. Responses to glucose and fructose were much smaller than those to 0.6 M umami, monosodium glutamate with amiloride, and lysine. C: heat map of responses from all double-KO neurons that exhibited significant responses to at least 1 sugar (KO1+3, n = 10; KO2+3, n = 8). Scale at right shows response magnitudes as a multiple of the response criterion (a response that just meets criterion = 1). Dark-filled circles = significant responses. Small x's = missing data. The representative KO2+3 cell shown in A and B is highlighted with a black rectangular box. Although each of these neurons was sugar responsive, invariably, another quality was more effective. D: proportions and average net responses to the sugars compared between WT and double-KO mice only for cells responsive to at least 1 sugar (WT, n = 47; double-KO, n = 18). Among WT cells that were sugar responsive, sucrose and the monosaccharides activated mostly the same neurons (“Both” slice of the pie charts) and evoked responses of similar magnitudes. In contrast, in double-KO neurons that were sugar-responsive, glucose and fructose activated more cells than did sucrose and elicited larger mean responses. (*ANOVA, P < 0.0005, fructose vs. sucrose, P = 0.001; glucose vs. sucrose, P < 0.0005; fructose vs. glucose, P > 0.1). E: glucose and fructose responses in the double-KO mice only, averaged over successive 500 ms for the 18 sugar-responsive cells normalized to the peak 500-ms bin. The time courses of the responses to the 2 monosaccharides are similar. F: normalized time courses averaged across glucose and fructose for double-KO versus WT mice. Responses in the double-KO mice are more sluggish (*ANOVA: strain × time, P < 0.0005). MSGa, monosodium glutamate with amiloride; IMP, inosine 5′-monophosphate; GLY, glycine; S, sucrose; GLU, glucose; FRU, fructose; I, citric acid; B, bitter; U, umami; N, NaCl; n.s, not significant; LYS, lysine; MAL, maltrin.

