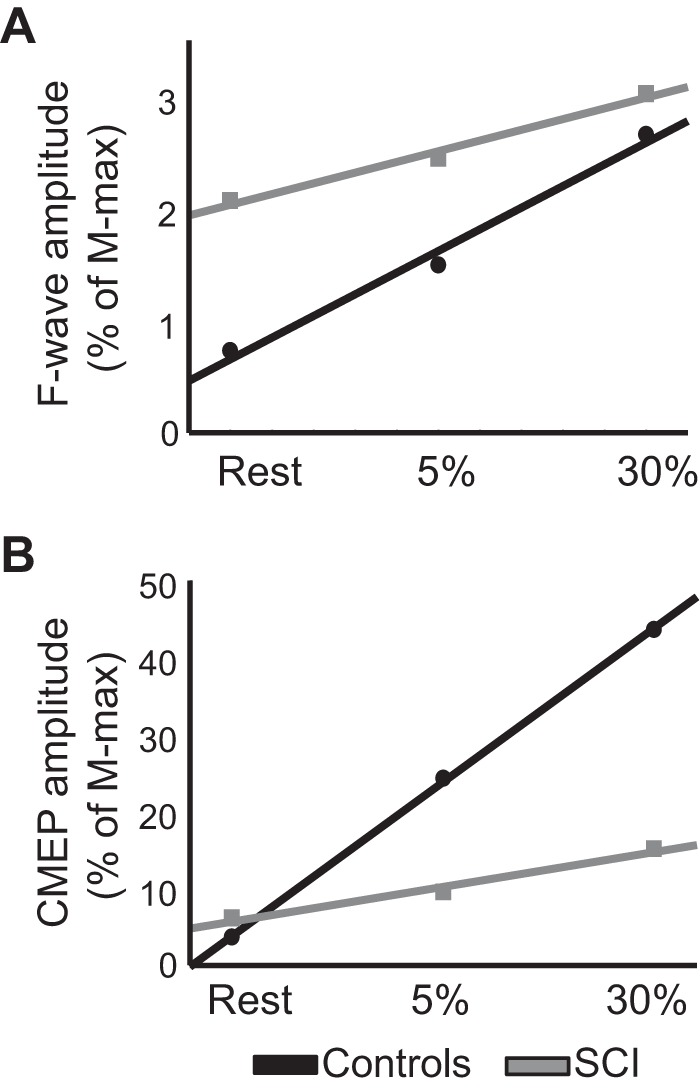
Fig. 5.

Slope of cervicomedullary motor-evoked potentials (CMEPs) and F waves. A and B: slope of F waves (A) and CMEPs (B) in controls (black) and spinal cord injury (SCI; gray) participants in all conditions tested. In A and B, the abscissa shows the conditions tested [REST and 5 and 30% of maximal voluntary contraction during index finger abduction] and the ordinate shows F-wave (A) and CMEPs (B) amplitudes as % of maximal motor response (M-max).
