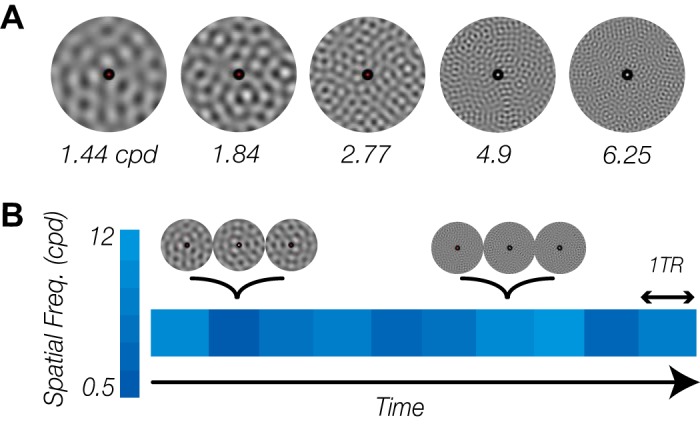
Fig. 1.

Stimulus and experimental procedure. A: example stimuli varying in spatial frequency content. Each stimulus was generated by filtering uniform noise with a narrow band-pass filter that had a central spatial frequency equal to the desired spatial frequency content. The 5 presented frequencies are only a subset of 40 different frequencies that were used for data collection; cpd, cycles/degree. B: exemplar time course of stimulus presentation. During each run, subjects viewed a series of visual stimuli that changed constantly and rapidly. In spite of the temporal dynamics of the visual stimuli, the spatial frequency content of the stimuli remained the same for 1 repetition time (TR) and then randomly changed to a new spatial frequency.
