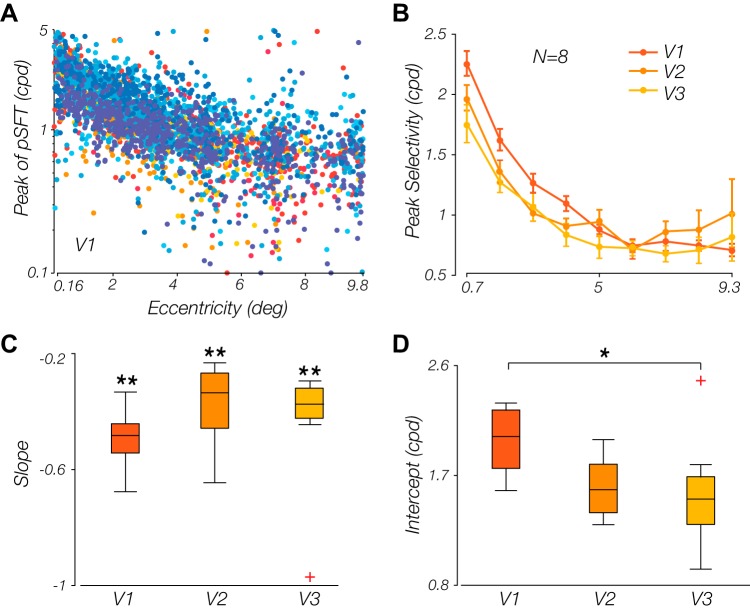
Fig. 4.
Relationship between the population spatial frequency tuning (pSFT) peak and retinotopic eccentricity. A: peak of the pSFT declines with eccentricity in area V1. Each point is a voxel. Data from each subject is displayed with a certain color; cpd, cycles/degree. B: mean subject-wise pSFT peak estimates within each eccentricity bin. Nine bins linearly spaced within the eccentricity range of [0.16°, 9.8°] have been used. Error bars show the means ± SE. C and D: parameters of the line that models the relationship between the peak pSFT and the eccentricity (both in logarithmic scale); slopes (C) and intercepts (D) of such lines, fitted per subject on the binned data (bins similar to B), are shown. The slopes are significantly <0 in all 3 cortical regions. The intercept of the V1 area is significantly larger than this value in V3 area and almost significantly larger than the corresponding value in V2 (*P < 0.05; **P < 0.001).

