
Fig. 5.
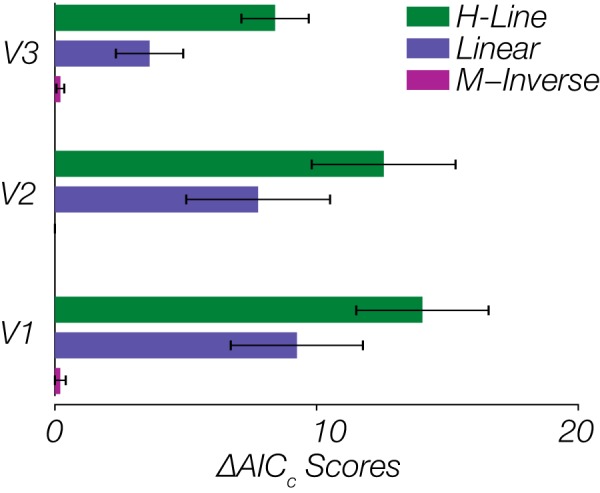
Comparison of model fits for peak-eccentricity relationship. The lowest change in corrected Akaike’s information criterion (ΔAICc) score across all visual areas of V1 to V3 belongs to the M-Inverse function. Performances of the Linear and H-Line models are very similar and poorer than the M-Inverse. Each bar shows the mean ΔAICc value across all eight subjects and the error bars represent the standard error of the mean. Note that the values for the M-Inverse are very small (indicating the best candidate model) and not very variable and thus difficult to see.